Immunology as a Metaphor for Computational ... - Napier University
Immunology as a Metaphor for Computational ... - Napier University
Immunology as a Metaphor for Computational ... - Napier University

You also want an ePaper? Increase the reach of your titles
YUMPU automatically turns print PDFs into web optimized ePapers that Google loves.
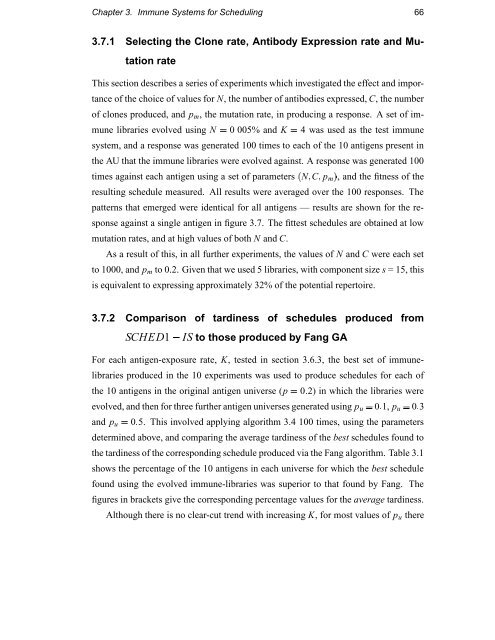
Chapter 3. Immune Systems <strong>for</strong> Scheduling 663.7.1 Selecting the Clone rate, Antibody Expression rate and MutationrateThis section describes a series of experiments which investigated the effect and importanceof the choice of values <strong>for</strong> N, the number of antibodies expressed, C, the numberof clones produced, and p m , the mutation rate, in producing a response. A set of immunelibraries evolved using 0¦ N 005% and K 4 w<strong>as</strong> used <strong>as</strong> the test immunesystem, and a response w<strong>as</strong> generated 100 times to each of the 10 antigens present inthe AU that the immune libraries were evolved against. A response w<strong>as</strong> generated 100times against each antigen using a set of parameters N¤ C¤ p m ¥ , and the fitness of theresulting schedule me<strong>as</strong>ured. All results were averaged over the 100 responses. The£patterns that emerged were identical <strong>for</strong> all antigens — results are shown <strong>for</strong> the responseagainst a single antigen in figure 3.7. The fittest schedules are obtained at lowmutation rates, and at high values of both N and C.As a result of this, in all further experiments, the values of N and C were each setto 1000, and p m to 0.2. Given that we used 5 libraries, with component size s = 15, thisis equivalent to expressing approximately 32% of the potential repertoire.3.7.2 Comparison of tardiness of schedules produced from4 SCHED1 IS to those produced by Fang GAFor each antigen-exposure rate, K, tested in section 3.6.3, the best set of immunelibrariesproduced in the 10 experiments w<strong>as</strong> used to produce schedules <strong>for</strong> each ofthe 10 antigens in the original antigen universe 0¦ (p 2) in which the libraries wereevolved, and then <strong>for</strong> three further antigen universes generated using p u 0¦ 1, p u 0¦ 3 and p u 0¦ 5. This involved applying algorithm 3.4 100 times, using the parametersdetermined above, and comparing the average tardiness of the best schedules found tothe tardiness of the corresponding schedule produced via the Fang algorithm. Table 3.1shows the percentage of the 10 antigens in each universe <strong>for</strong> which the best schedulefound using the evolved immune-libraries w<strong>as</strong> superior to that found by Fang. Thefigures in brackets give the corresponding percentage values <strong>for</strong> the average tardiness.Although there is no clear-cut trend with incre<strong>as</strong>ing K, <strong>for</strong> most values of p u there


![Unit 5. Switches and VLANs [PDF]](https://img.yumpu.com/34422504/1/184x260/unit-5-switches-and-vlans-pdf.jpg?quality=85)