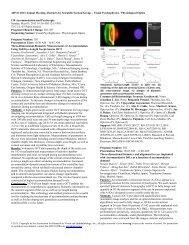
<strong>ARVO</strong> 2013 Annual Meeting Abstracts by Scientific Section/Group - <strong>Biochemistry</strong>/<strong>Molecular</strong> <strong>Biology</strong>Fig 1. Indirect immunofluorescence evaluation of apelin-13 andGFAP distribution in retina of normal rats (A), diabetic rats (B) andF13A-injected diabetic rats(C). Merged images contain three colorchannels representing apelin-13 (red), GFAP (green) and DAPI(blue). Densitometric quantification of GFAP activity (D), GCL,ganglion cell layer; INL, inner nuclear layer; IPL, inner plexiformlayer; ONL, outer nuclear layer.F13A, F13A-injected group. **indicates p < 0.01. Scale bars: 50µm.Univesity of Oklahoma Health Sciences Center, Oklahoma City, OK;2 Department of Medicine, University of OKlahoma Health SciencesCenter, Oklahoma City, OK; 3 Harold Hamm Diabetes Center,Univesity of Oklahoma Health Sciences Center, Oklahoma City, OK.Purpose: Diabetic retinopathy is a microvascular complication ofdiabetes mellitus and is the leading cause of blindness in developedcountries. MicroRNAs (miRNAs) are small, no-coding RNAs whichnegatively regulate target gene expression at the post-transcriptionlevel. miRNAs play important roles in pathological processes ofmany diseases. This study is to investigate changes of the miRNAprofile in diabetic retinopathy and to elucidate the potential role of aspecific miRNA, miR-200b in a type 1 diabetic mouse model.Methods: The visual functions of both Akita and wild-type (WT)mice were examined by electroretinogram (ERG) recording. RNAswere extracted from the retina of Akita mice (9 months of age) andage-matched WT mice. miRNA expression profiles were comparedusing a miRNA-specific microarray, and the expression change ofmiR-200b was confirmed by Taqman qPCR. The level of miR-200bwas also examined in a human Müller cell line (MIO-M1) after thetreatment of 4-hydroxynonenal (4-HNE). The target gene(s) of miR-200b was predicted in silico and confirmed by luciferase assay. Thefunction and role of target gene(s) of miR-200b was tested andverified in MIO-M1 cells by Western blotting and TUNEL assay.Results: ERG recording showed progressive declines of ERGresponses in Akita mice when compared with age-matched WT mice.Microarray and real-time PCR indicated that miR-200b wassignificantly up-regulated in the retina of Akita mice. Computationalsequence analysis and luciferase assay identified that Oxidationresistant 1 (Oxr1) was a direct target gene of miR-200b. In the retinaof Akita mice and in MIO-M1 cells exposed to 4-HNE, the upregulationof miR-200b correlated with down-regulation of the Oxr1mRNA levels in the retina. In MIO-M1 cells, miR-200b mimictransfection down-regulated Oxr1 expression, while the inhibitor ofmiR-200b increased Oxr1 expression. Moreover, the over-expressionof recombinant Oxr1 enhanced cell survival and reduced the 3-nitrotyrosine levels in MIO-M1 cells exposed to 4-HNE.Conclusions: The up-regulation of miR-200b in diabetes reduces theexpression of Oxr1 and weakens the anti-oxidant function of Oxr1 indiabetic retinopathy.Commercial Relationships: Qian Chen, None; Anne Murray,None; Yusuke Takahashi, None; Kelu Zhou, None; KyoungminPark, None; Jian-Xing Ma, NoneSupport: IH grants (EY018659, EY012231, EY019309,P20GM104934) and OCAST (HR12-103)Fig 2. RT-PCR and Western blot analysis showed the mRNA (A) andprotein (B) expression of apelin-13, GFAP and VEGF in diabeticrats, and representative Western blots are shown in Fig.3C **indicates p
<strong>ARVO</strong> 2013 Annual Meeting Abstracts by Scientific Section/Group - <strong>Biochemistry</strong>/<strong>Molecular</strong> <strong>Biology</strong>Results: In eyes with diabetic macular edema, the Pearsoncorrelation coefficient for choroidal and macular thickness at thefovea was r=0.39 (p=0.002); at 500μm from the fovea, r=0.063(p=0.6); at 1000μm, r=-0.026 (p=0.85); at 1500μm; r=-0.20 (p=0.17);and at 3000μm, r=0.084 (p=0.55). In non-diabetics, the correlation atthe fovea was r= -0.22 (p=0.11); at 500μm, r=-0.17 (p=0.20); at1000μm, r=012 (p=0.40); at 1500μm, r=0.068 (p=0.62); and at3000μm, r=-0.11 (p=0.40).The average choroidal thickness in diabetics was thinner than in nondiabetics(282μm vs. 369μm, respectively, p