Detector Selection for Spectrum analyzer Measurements
Detector Selection for Spectrum analyzer Measurements
Detector Selection for Spectrum analyzer Measurements

You also want an ePaper? Increase the reach of your titles
YUMPU automatically turns print PDFs into web optimized ePapers that Google loves.
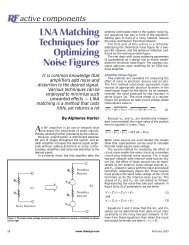
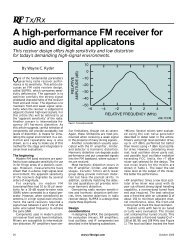
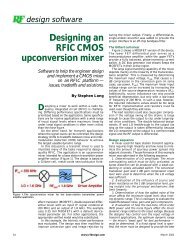
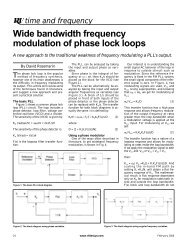
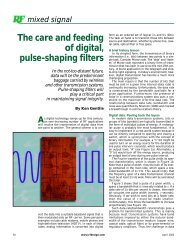
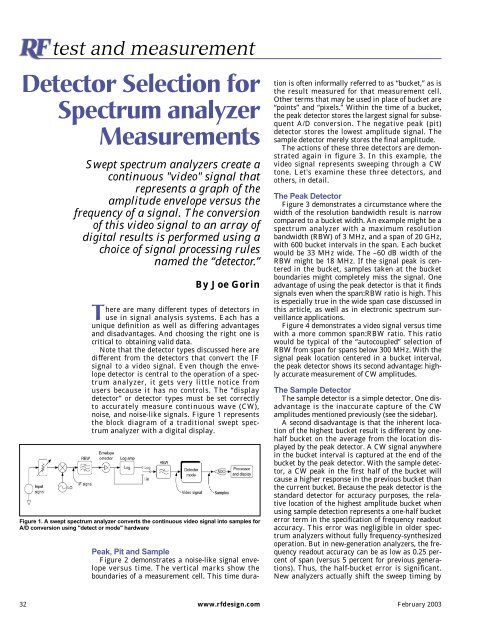
test and measurement<strong>Detector</strong> <strong>Selection</strong> <strong>for</strong><strong>Spectrum</strong> <strong>analyzer</strong><strong>Measurements</strong>Swept spectrum <strong>analyzer</strong>s create acontinuous "video" signal thatrepresents a graph of theamplitude envelope versus thefrequency of a signal. The conversionof this video signal to an array ofdigital results is per<strong>for</strong>med using achoice of signal processing rulesnamed the “detector.”By Joe GorinThere are many different types of detectors inuse in signal analysis systems. Each has aunique definition as well as differing advantagesand disadvantages. And choosing the right one iscritical to obtaining valid data.Note that the detector types discussed here aredifferent from the detectors that convert the IFsignal to a video signal. Even though the envelopedetector is central to the operation of a spectrum<strong>analyzer</strong>, it gets very little notice fromusers because it has no controls. The “displaydetector” or detector types must be set correctlyto accurately measure continuous wave (CW),noise, and noise-like signals. Figure 1 representsthe block diagram of a traditional swept spectrum<strong>analyzer</strong> with a digital display.Figure 1. A swept spectrum <strong>analyzer</strong> converts the continuous video signal into samples <strong>for</strong>A/D conversion using "detect or mode" hardwarePeak, Pit and SampleFigure 2 demonstrates a noise-like signal envelopeversus time. The vertical marks show theboundaries of a measurement cell. This time durationis often in<strong>for</strong>mally referred to as “bucket,” as isthe result measured <strong>for</strong> that measurement cell.Other terms that may be used in place of bucket are“points” and “pixels.” Within the time of a bucket,the peak detector stores the largest signal <strong>for</strong> subsequentA/D conversion. The negative peak (pit)detector stores the lowest amplitude signal. Thesample detector merely stores the final amplitude.The actions of these three detectors are demonstratedagain in figure 3. In this example, thevideo signal represents sweeping through a CWtone. Let's examine these three detectors, andothers, in detail.The Peak <strong>Detector</strong>Figure 3 demonstrates a circumstance where thewidth of the resolution bandwidth result is narrowcompared to a bucket width. An example might be aspectrum <strong>analyzer</strong> with a maximum resolutionbandwidth (RBW) of 3 MHz, and a span of 20 GHz,with 600 bucket intervals in the span. Each bucketwould be 33 MHz wide. The –60 dB width of theRBW might be 18 MHz. If the signal peak is centeredin the bucket, samples taken at the bucketboundaries might completely miss the signal. Oneadvantage of using the peak detector is that it findssignals even when the span:RBW ratio is high. Thisis especially true in the wide span case discussed inthis article, as well as in electronic spectrum surveillanceapplications.Figure 4 demonstrates a video signal versus timewith a more common span:RBW ratio. This ratiowould be typical of the “autocoupled” selection ofRBW from span <strong>for</strong> spans below 300 MHz. With thesignal peak location centered in a bucket interval,the peak detector shows its second advantage: highlyaccurate measurement of CW amplitudes.The Sample <strong>Detector</strong>The sample detector is a simple detector. One disadvantageis the inaccurate capture of the CWamplitudes mentioned previously (see the sidebar).A second disadvantage is that the inherent locationof the highest bucket result is different by onehalfbucket on the average from the location displayedby the peak detector. A CW signal anywherein the bucket interval is captured at the end of thebucket by the peak detector. With the sample detector,a CW peak in the first half of the bucket willcause a higher response in the previous bucket thanthe current bucket. Because the peak detector is thestandard detector <strong>for</strong> accuracy purposes, the relativelocation of the highest amplitude bucket whenusing sample detection represents a one-half bucketerror term in the specification of frequency readoutaccuracy. This error was negligible in older spectrum<strong>analyzer</strong>s without fully frequency-synthesizedoperation. But in new-generation <strong>analyzer</strong>s, the frequencyreadout accuracy can be as low as 0.25 percentof span (versus 5 percent <strong>for</strong> previous generations).Thus, the half-bucket error is significant.New <strong>analyzer</strong>s actually shift the sweep timing by32 www.rfdesign.com February 2003
Figure 2. Peak, pit and sample detection of anoise-like signal0.5 bucket to overcome the frequencyaccuracy impact of the sample detector.The primary uses of the sampledetector are in the measurement ofnoise and noise-like signals, and nearnoiseCW amplitudes. The peak detectoremphasizes noise because it catchesthe peak excursions. This behaviormakes measuring a low-level CW signalerror-prone. But the sample detectordoes not peak-bias bucket results,improving signal-to-noise ratio.There<strong>for</strong>e, when averaged, the resultsof sample detection are excellent inmeasuring small CW signals. For adetailed explanation of measuringsmall CW signals, see reference note 1.Because of its usefulness in measuringnoise, the sample detector is usuallyused in “noise marker” applications(refer to the sidebar).Similarly, the measurement of channelpower (CP) and adjacent-channelpower (ACP) requires a detector typethat gives results unbiased by peakdetection. For <strong>analyzer</strong>s without averagingdetectors, sample detection is thebest choice.The Negative Peak <strong>Detector</strong>While the negative peak detector isavailable in almost all spectrum <strong>analyzer</strong>s,it is rarely used. It is mostlyuse <strong>for</strong> comparing peak and negativepeak results in electromagnetic compatibility(EMC) applications. Thisallow the user to differentiate CWfrom impulsive signals.Signal-and-noise <strong>Detector</strong>s<strong>Detector</strong> types are useful becausethere is often more in<strong>for</strong>mation in thecontinuous video signal than can bedisplayed with a fixed number of displaylocations. Analyzers used in theera be<strong>for</strong>e digital displays were effectivein displaying signal peaks. These<strong>analyzer</strong>s represented noise as gradationsof display intensity. They dependedon the statistics of signal-amplitudedistribution. For these <strong>analyzer</strong>s, theFigure 3. Peak, pit and sample detection <strong>for</strong> RBWnarrow compared to the bucket widthdifference between the CW- and noiselikesignals was immediately apparent.There are a number of manufacturerspecificapproaches to achieve a similarappearance. Referred to by names suchas “normal” and “auto peak,” they showthe peak-to-peak excursions of theamplitude envelope of a signal to givenoise signals an apparent vertical width,while CW signals show as a single-valuedtrace across the screen.Because these detectors are complexto implement and unnecessary <strong>for</strong> precisionmeasurements, they are used onlyin the high-per<strong>for</strong>mance end of the productlines of spectrum <strong>analyzer</strong> manufacturers(see reference note 2).Averaging <strong>Detector</strong>sThe latest generations of spectrum<strong>analyzer</strong>s have various implementationmethods of averaging detection.In an averaging detector, the amplitudeof the signal envelope is averagedduring the time (and frequency) intervalof a bucket.The primary application of averagedetection is in CP and ACP measurements.These measurements involvesumming power across a range of <strong>analyzer</strong>frequency buckets.The average detector allows animprovement over using sample detection<strong>for</strong> the summation. It changes channelpower measurements from being asummation over a range of buckets intoan integration over the time intervalrepresenting a range of frequencies in aswept <strong>analyzer</strong>. In a fast Fourier trans<strong>for</strong>m(FFT) <strong>analyzer</strong>, the summationused <strong>for</strong> channel power measurementschanges from being a summation overdisplay buckets to being a summationover FFT bins. In both swept and FFTcases, the integration captures all thepower in<strong>for</strong>mation available, ratherthan just that which is sampled by thesample detector. As a result, the averagedetector has a lower varianceresult <strong>for</strong> the same measurementtime. In swept analysis, it also allowsFigure 4. A signal peak centered in a bucket willbe higher than the highest samplethe convenience of reducing variancesimply by extending the sweep time.The scale on which the averagingoccurs is an important part of the measurement.Some spectrum <strong>analyzer</strong>s willrefer to the averaging detector as a rootmean-square(RMS) detector when itaverages power. These same <strong>analyzer</strong>shave an average detector. The averagedetector averages the voltage envelopeof the signal. Others have an averagedetector and a separate control to selectthe averaging scale. All the averagingprocesses work on the same scale,including power (RMS voltage), voltage(envelope) and log (decibels). The averagingprocesses that apply are the averagedetector plus three others: traceaveraging, VBW filtering, and noisemarker averaging.EMC <strong>Detector</strong>sReceivers <strong>for</strong> characterizing devices<strong>for</strong> electromagnetic compatibility (EMC)use quasi-peak detectors (QPD) andaverage detection. These specializeddetectors are not used <strong>for</strong> spectrumanalysis, and are beyond the scope ofthis article. A few spectrum <strong>analyzer</strong>simplement these detectors <strong>for</strong> EMCmeasurements. As a result, there is aterminology conflict between the averagedetector discussed previously andthe average detection <strong>for</strong> EMC applications.These detectors are completely differentand can potentially be confused.FFTs and <strong>Detector</strong> TypesIt has been discussed how detectortypes allow <strong>for</strong> the conversion of continuous-amplitudeversus frequencyin<strong>for</strong>mation into an array of digitizedresults. FFT analysis can have thesame detector relationships eventhough there is no such continuoussignal as a starting point.Just as detector types allowed anyswept video signal to be converted intoan array of trace buckets, so too candetector types be used to convert any34 www.rfdesign.com February 2003
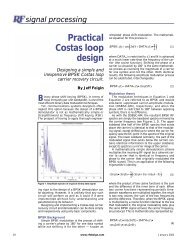
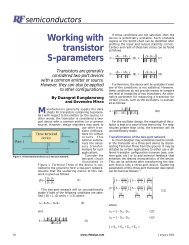
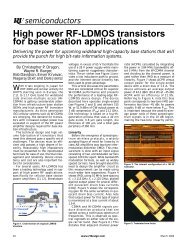
Noise MarkersThe “noise marker” function is useful <strong>for</strong> measuring thepower spectral density (PSD) of noise-like signals. Whenactivated, the bucket amplitudes near the marker location(typically 5 percent of the displayed span) are averaged.The PSD is estimated from this average by normalizing toa 1 Hz ideal bandwidth. The normalization is based on thepredicted noise power bandwidth of the RBW filter and theknown response of the averaging process to noise-like signals.Typically, the <strong>analyzer</strong> uses a log scale, which is knownto under- respond by 2.51 dB to noise-like signals on average.The averaging that occurs can be due to the noisemarker processing itself, VBW filtering, or trace averaging.Noise measurements made on a power scale are fasterthan those taken on a log scale.Under some rare circumstances, such as rotating medianoise measurements, the peak detector is used <strong>for</strong> noisemeasurements. Some <strong>analyzer</strong>s can make noise measurementsin peak, negative peak and normal detector modes,in addition to the traditional sample detector and the superioraverage detector. They also can make the computationon log, linear and power scales. The autocoupled combinationof average detector and power scale is the fastest.Special FunctionsFigure B is a graph of the highest sample amplitude versusthe signal frequency. It repeats with a period of the frequencywidth of a bucket. This is a scallop shape.Scalloping error is the difference between the highest sampleresult and the peak result.The term “scalloping error” is not commonly used todescribe the sample detector. It is a common term in FFTspectrum analysis. FFT computation results are just samplesof a continuous spectrum. Fig- ure B applies di- rectlyto FFT an- alysis, except that the period of the scallop isone FFT bin in- stead of one bucket.Designers of FFT processing choose a “windowing” operationpartly to control the scalloping error of their analysis.They often trade off the passband width (making <strong>for</strong> awider passband, and thus less frequency resolution) tominimize scalloping error. But in a hybrid FFT/swept <strong>analyzer</strong>with detector types, the peak detector eliminates scallopingerror. The windowing function, which affects theshape of the RBW filter in FFT analysis, can be chosen <strong>for</strong>the best tradeoff between selectivity and speed.For Gaussian-shaped RBW filters, the maximum scallopingerror depends on the RBW, the span, and the numberof buckets in the display. The maximum scalloping error is:Scalloping Error in FFTs and Sample DetectionIn figure A, the same video signal is shown with threedifferent relationships between the time of the peak of thevid- eo signal and the time of the samples. Signal onereaches its peak exactly at the sample instant. In this case,the largest sampled amplitude is the same one that wouldbe read by a peak detector. But as the signal moves to theright (signals 2 and 3), the highest bucket result becomeslower in amplitude. The worst case is signal three, with itspeak midway between samples. As the signal moves furtherto the right, the highest bucket result moves to thenext bucket and starts to rise in amplitude.⎛E max = 3.01 dB • ⎜⎝span ⎞( − 1)⎟⎠RBW NbuckOne typical <strong>analyzer</strong> will have a span:RBW ratio autocoupledto 106:1, and 601 buckets, giving a maximum scallopingerror of 0.09 dB with the sample detector.The average detector also has a response variation withfrequency with a scallop shape. Unlike the sample detector,its minimum error is not zero. This is because averagingacross the top of an RBW shape cannot give a responseas high as the peak. The average detector response versusfrequency varies from 0.33 to 1.33 of the E max evaluatedabove. This case demonstrates why the average detector isnot the preferred detector <strong>for</strong> CW signals. The scallopingerror of the average detector is only an error in peakresponse, not in total power. Total power response measurements,such as channel power, are the intended use ofthe average detector.2Figure A. Four different timing relationships between the video signal and thebucket edgesFigure B. The highest signal amplitude varies respectively with signal frequency36 www.rfdesign.com February 2003
FFT bin results into an array of tracebuckets. Thus, detector types allowswept and FFT analysis to behave nearlyidentically.Optimum and Automatic <strong>Selection</strong>of <strong>Detector</strong> TypesThis article has discussed the advantagesand disadvantages of the variousdetector types. At this point enoughin<strong>for</strong>mation has been presented to allowthe designer to select the detector that ismost appropriate <strong>for</strong> the measurementbeing made.Previous generations of spectrum<strong>analyzer</strong>s have a “quasi-auto” selectionmechanism. Examples of quasi-autobehavior include changing to “sample”detector upon enabling the noise markerfunction, or when turning on trace averaging,then returning to the originaldetector type upon leaving noise markeror averaging. Many modern <strong>analyzer</strong>sallow automatic or manual selection ofdetectors.SummaryThe right detector type allows accuratenoise measurements, CW measurements,adjacent-channel power measurements,as well as others. In addition,detector types allow unification ofFFT and swept analysis techniques.References.1. Joe Gorin, “<strong>Spectrum</strong> Analyzer<strong>Measurements</strong> and Noise,” AgilentTechnologies Application Note 1303,April 1998.2. Steven N. Holdaway, et al, “SignalProcessing in the Model 8568A <strong>Spectrum</strong>Analyzer,” Hewlett-PackardJournal, June 1978.About the authorJoe Gorin is a master engineer atAgilent Technologies. He joinedHewlett-Packard Company, whichspun off Agilent, immediately upongraduating from MIT with SBEE andSMEE degrees in 1974. Most of theyears since have been spent concentratingon the development of newspectrum <strong>analyzer</strong>s. He can bereached at joe_gorin@agilent.com.38 www.rfdesign.com February2003