ericssonhistory.com
ericssonhistory.com
ericssonhistory.com
- No tags were found...

You also want an ePaper? Increase the reach of your titles
YUMPU automatically turns print PDFs into web optimized ePapers that Google loves.
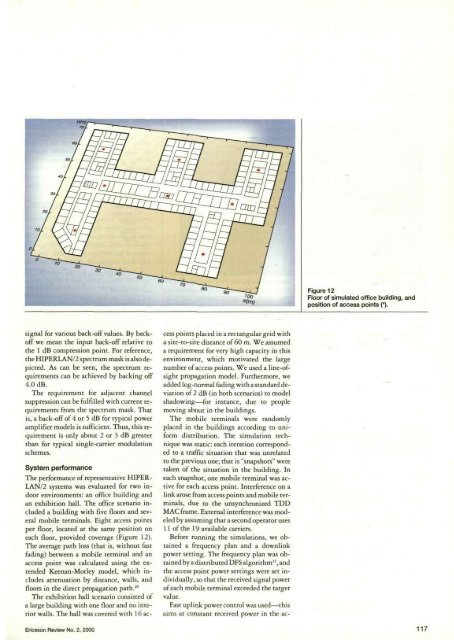
Figure 12Floor of simulated office building, andposition of access points (*).signal for various back-off values. By backoffwe mean the input back-off relative tothe 1 dB <strong>com</strong>pression point. For reference,the HIPERLAN/2 spectrum mask is also depicted.As can be seen, the spectrum requirementscan be achieved by backing off4.0 dB.The requirement for adjacent channelsuppression can be fulfilled with current requirementsfrom the spectrum mask. Thatis, a back-off of 4 or 5 dB for typical poweramplifier models is sufficient. Thus, this requirementis only about 2 or 3 dB greaterthan for typical single-carrier modulationschemes.System performanceThe performance of representative HIPERLAN/2 systems was evaluated for two indoorenvironments: an office building andan exhibition hall. The office scenario includeda building with five floors and severalmobile terminals. Eight access pointsper floor, located at the same position oneach floor, provided coverage (Figure 12).The average path loss (that is, without fastfading) between a mobile terminal and anaccess point was calculated using the extendedKeenan-Motley model, which includesattenuation by distance, walls, andfloors in the direct propagation path. 20The exhibition hall scenario consisted ofa large building with one floor and no interiorwalls. The hall was covered with 16 accesspoints placed in a rectangular grid witha site-to-site distance of 60 m. We assumeda requirement for very high capacity in thisenvironment, which motivated the largenumber of access points. We used a line-ofsightpropagation model. Furthermore, weadded log-normal fading with a standard deviationof 2 dB (in both scenarios) to modelshadowing-—for instance, due to peoplemoving about in the buildings.The mobile terminals were randomlyplaced in the buildings according to uniformdistribution. The simulation techniquewas static: each iteration correspondedto a traffic situation that was unrelatedto the previous one; that is "snapshots" weretaken of the situation in the building. Ineach snapshot, one mobile terminal was activefor each access point. Interference on alink arose from access points and mobile terminals,due to the unsynchtonized TDDMAC frame. External interference was modeledby assuming that a second operator uses11 of the 19 available carriers.Before running the simulations, we obtaineda frequency plan and a downlinkpower setting. The frequency plan was obtainedby a distributed DFS algorithm' 2 , andthe access point power settings were set individually,so that the received signal powetof each mobile terminal exceeded the targetvalue.Fast uplink power control was used—thisaims at constant received power in the ac-Ericsson Review No. 2, 2000 117