e-Waste Assessment Tanzania - e-Waste. This guide
e-Waste Assessment Tanzania - e-Waste. This guide
e-Waste Assessment Tanzania - e-Waste. This guide
- No tags were found...

You also want an ePaper? Increase the reach of your titles
YUMPU automatically turns print PDFs into web optimized ePapers that Google loves.
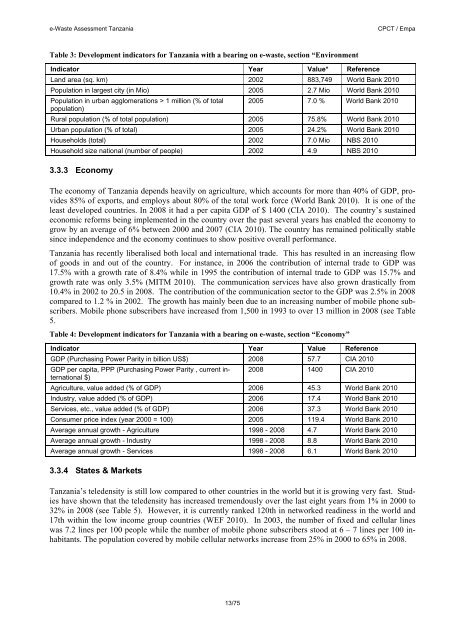
e-<strong>Waste</strong> <strong>Assessment</strong> <strong>Tanzania</strong>CPCT / EmpaTable 3: Development indicators for <strong>Tanzania</strong> with a bearing on e-waste, section “EnvironmentIndicator Year Value* ReferenceLand area (sq. km) 2002 883,749 World Bank 2010Population in largest city (in Mio) 2005 2.7 Mio World Bank 2010Population in urban agglomerations > 1 million (% of totalpopulation)2005 7.0 % World Bank 2010Rural population (% of total population) 2005 75.8% World Bank 2010Urban population (% of total) 2005 24.2% World Bank 2010Households (total) 2002 7.0 Mio NBS 2010Household size national (number of people) 2002 4.9 NBS 20103.3.3 EconomyThe economy of <strong>Tanzania</strong> depends heavily on agriculture, which accounts for more than 40% of GDP, provides85% of exports, and employs about 80% of the total work force (World Bank 2010). It is one of theleast developed countries. In 2008 it had a per capita GDP of $ 1400 (CIA 2010). The country’s sustainedeconomic reforms being implemented in the country over the past several years has enabled the economy togrow by an average of 6% between 2000 and 2007 (CIA 2010). The country has remained politically stablesince independence and the economy continues to show positive overall performance.<strong>Tanzania</strong> has recently liberalised both local and international trade. <strong>This</strong> has resulted in an increasing flowof goods in and out of the country. For instance, in 2006 the contribution of internal trade to GDP was17.5% with a growth rate of 8.4% while in 1995 the contribution of internal trade to GDP was 15.7% andgrowth rate was only 3.5% (MITM 2010). The communication services have also grown drastically from10.4% in 2002 to 20.5 in 2008. The contribution of the communication sector to the GDP was 2.5% in 2008compared to 1.2 % in 2002. The growth has mainly been due to an increasing number of mobile phone subscribers.Mobile phone subscribers have increased from 1,500 in 1993 to over 13 million in 2008 (see Table5.Table 4: Development indicators for <strong>Tanzania</strong> with a bearing on e-waste, section “Economy”Indicator Year Value ReferenceGDP (Purchasing Power Parity in billion US$) 2008 57.7 CIA 2010GDP per capita, PPP (Purchasing Power Parity , current international$)2008 1400 CIA 2010Agriculture, value added (% of GDP) 2006 45.3 World Bank 2010Industry, value added (% of GDP) 2006 17.4 World Bank 2010Services, etc., value added (% of GDP) 2006 37.3 World Bank 2010Consumer price index (year 2000 = 100) 2005 119.4 World Bank 2010Average annual growth - Agriculture 1998 - 2008 4.7 World Bank 2010Average annual growth - Industry 1998 - 2008 8.8 World Bank 2010Average annual growth - Services 1998 - 2008 6.1 World Bank 20103.3.4 States & Markets<strong>Tanzania</strong>’s teledensity is still low compared to other countries in the world but it is growing very fast. Studieshave shown that the teledensity has increased tremendously over the last eight years from 1% in 2000 to32% in 2008 (see Table 5). However, it is currently ranked 120th in networked readiness in the world and17th within the low income group countries (WEF 2010). In 2003, the number of fixed and cellular lineswas 7.2 lines per 100 people while the number of mobile phone subscribers stood at 6 – 7 lines per 100 inhabitants.The population covered by mobile cellular networks increase from 25% in 2000 to 65% in 2008.13/75