e-Waste Assessment Tanzania - e-Waste. This guide
e-Waste Assessment Tanzania - e-Waste. This guide
e-Waste Assessment Tanzania - e-Waste. This guide
- No tags were found...

You also want an ePaper? Increase the reach of your titles
YUMPU automatically turns print PDFs into web optimized ePapers that Google loves.
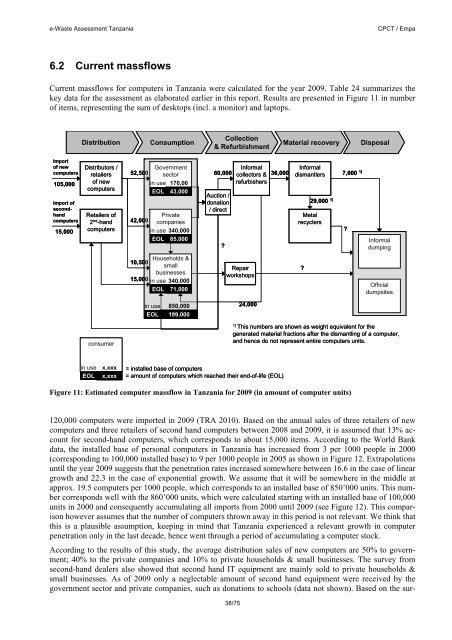
e-<strong>Waste</strong> <strong>Assessment</strong> <strong>Tanzania</strong>CPCT / Empa6.2 Current massflowsCurrent massflows for computers in <strong>Tanzania</strong> were calculated for the year 2009. Table 24 summarizes thekey data for the assessment as elaborated earlier in this report. Results are presented in Figure 11 in numberof items, representing the sum of desktops (incl. a monitor) and laptops.CollectionDistribution Consumption Material recoveryDisposal& RefurbishmentImportof newcomputers105,000Import ofsecondhandcomputers15,000Distributors /retailersof newcomputersRetailers of2 nd -handcomputers52,500Governmentsectorin use170,00EOL43,00042,000Privatecompaniesin use340,000EOL85,00060,000 Auction /InformalInformalcollectors &36,000 dismantlersrefurbishers7,000 1)donation29,000 1) / directMetalrecyclers??InformaldumpingHouseholds &10,500smallbusinesses15,000in use340,000EOL71,000Repairworkshops?Officialdumpsitesin useEOL850,000199,00024,000consumer1) <strong>This</strong> numbers are shown as weight equivalent for thegenerated material fractions after the dismantling of a computer,and hence do not represent entire computers units.in useEOLx,xxxx,xxx= installed base of computers= amount of computers which reached their end-of-life (EOL)Figure 11: Estimated computer massflow in <strong>Tanzania</strong> for 2009 (in amount of computer units)120,000 computers were imported in 2009 (TRA 2010). Based on the annual sales of three retailers of newcomputers and three retailers of second hand computers between 2008 and 2009, it is assumed that 13% accountfor second-hand computers, which corresponds to about 15,000 items. According to the World Bankdata, the installed base of personal computers in <strong>Tanzania</strong> has increased from 3 per 1000 people in 2000(corresponding to 100,000 installed base) to 9 per 1000 people in 2005 as shown in Figure 12. Extrapolationsuntil the year 2009 suggests that the penetration rates increased somewhere between 16.6 in the case of lineargrowth and 22.3 in the case of exponential growth. We assume that it will be somewhere in the middle atapprox. 19.5 computers per 1000 people, which corresponds to an installed base of 850’000 units. <strong>This</strong> numbercorresponds well with the 860’000 units, which were calculated starting with an installed base of 100,000units in 2000 and consequently accumulating all imports from 2000 until 2009 (see Figure 12). <strong>This</strong> comparisonhowever assumes that the number of computers thrown away in this period is not relevant. We think thatthis is a plausible assumption, keeping in mind that <strong>Tanzania</strong> experienced a relevant growth in computerpenetration only in the last decade, hence went through a period of accumulating a computer stock.According to the results of this study, the average distribution sales of new computers are 50% to government;40% to the private companies and 10% to private households & small businesses. The survey fromsecond-hand dealers also showed that second hand IT equipment are mainly sold to private households &small businesses. As of 2009 only a neglectable amount of second hand equipment were received by thegovernment sector and private companies, such as donations to schools (data not shown). Based on the sur-38/75