Andy Sumner - Institute of Development Studies
Andy Sumner - Institute of Development Studies
Andy Sumner - Institute of Development Studies
You also want an ePaper? Increase the reach of your titles
YUMPU automatically turns print PDFs into web optimized ePapers that Google loves.
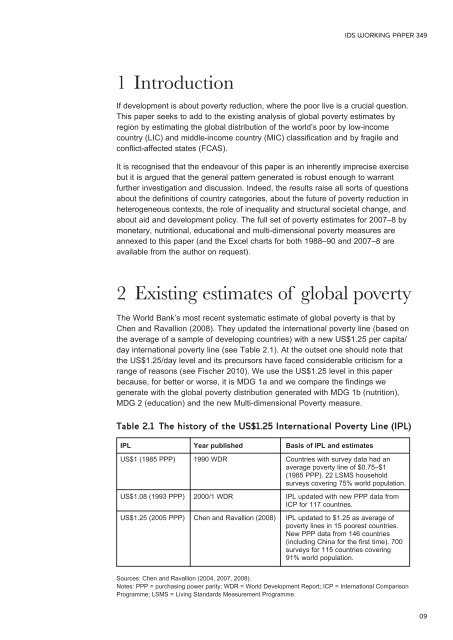
IDS WORKING PAPER 3491 IntroductionIf development is about poverty reduction, where the poor live is a crucial question.This paper seeks to add to the existing analysis <strong>of</strong> global poverty estimates byregion by estimating the global distribution <strong>of</strong> the world’s poor by low-incomecountry (LIC) and middle-income country (MIC) classification and by fragile andconflict-affected states (FCAS).It is recognised that the endeavour <strong>of</strong> this paper is an inherently imprecise exercisebut it is argued that the general pattern generated is robust enough to warrantfurther investigation and discussion. Indeed, the results raise all sorts <strong>of</strong> questionsabout the definitions <strong>of</strong> country categories, about the future <strong>of</strong> poverty reduction inheterogeneous contexts, the role <strong>of</strong> inequality and structural societal change, andabout aid and development policy. The full set <strong>of</strong> poverty estimates for 2007–8 bymonetary, nutritional, educational and multi-dimensional poverty measures areannexed to this paper (and the Excel charts for both 1988–90 and 2007–8 areavailable from the author on request).2 Existing estimates <strong>of</strong> global povertyThe World Bank’s most recent systematic estimate <strong>of</strong> global poverty is that byChen and Ravallion (2008). They updated the international poverty line (based onthe average <strong>of</strong> a sample <strong>of</strong> developing countries) with a new US$1.25 per capita/day international poverty line (see Table 2.1). At the outset one should note thatthe US$1.25/day level and its precursors have faced considerable criticism for arange <strong>of</strong> reasons (see Fischer 2010). We use the US$1.25 level in this paperbecause, for better or worse, it is MDG 1a and we compare the findings wegenerate with the global poverty distribution generated with MDG 1b (nutrition),MDG 2 (education) and the new Multi-dimensional Poverty measure.Table 2.1 The history <strong>of</strong> the US$1.25 International Poverty Line (IPL)IPL Year published Basis <strong>of</strong> IPL and estimatesUS$1 (1985 PPP) 1990 WDR Countries with survey data had anaverage poverty line <strong>of</strong> $0.75–$1(1985 PPP). 22 LSMS householdsurveys covering 75% world population.US$1.08 (1993 PPP) 2000/1 WDR IPL updated with new PPP data fromICP for 117 countries.US$1.25 (2005 PPP) Chen and Ravallion (2008) IPL updated to $1.25 as average <strong>of</strong>poverty lines in 15 poorest countries.New PPP data from 146 countries(including China for the first time). 700surveys for 115 countries covering91% world population.Sources: Chen and Ravallion (2004, 2007, 2008).Notes: PPP = purchasing power parity; WDR = World <strong>Development</strong> Report; ICP = International ComparisonProgramme; LSMS = Living Standards Measurement Programme.09


