

Andy Sumner - Institute of Development Studies
Andy Sumner - Institute of Development Studies
Andy Sumner - Institute of Development Studies

You also want an ePaper? Increase the reach of your titles
YUMPU automatically turns print PDFs into web optimized ePapers that Google loves.
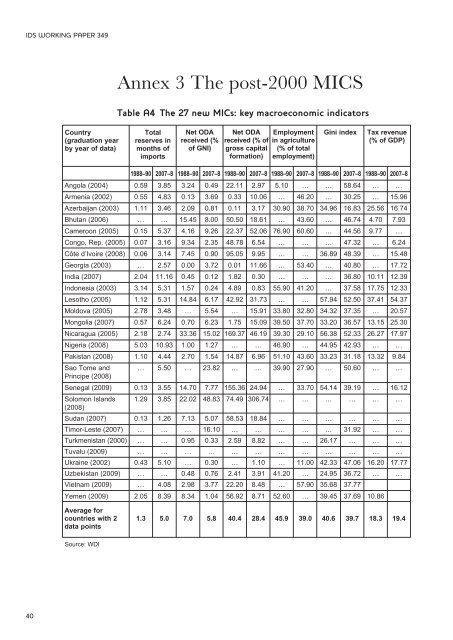
IDS WORKING PAPER 349Annex 3 The post-2000 MICSTable A4 The 27 new MICs: key macroeconomic indicatorsCountry(graduation yearby year <strong>of</strong> data)Totalreserves inmonths <strong>of</strong>importsNet ODAreceived (%<strong>of</strong> GNI)Net ODAreceived (% <strong>of</strong>gross capitalformation)Employmentin agriculture(% <strong>of</strong> totalemployment)Gini indexTax revenue(% <strong>of</strong> GDP)1988–90 2007–8 1988–90 2007–8 1988–90 2007–8 1988–90 2007–8 1988–90 2007–8 1988–90 2007–8Angola (2004) 0.59 3.85 3.24 0.49 22.11 2.97 5.10 … … 58.64 … …Armenia (2002) 0.55 4.83 0.13 3.69 0.33 10.06 … 46.20 … 30.25 … 15.96Azerbaijan (2003) 1.11 3.46 2.09 0.81 0.11 3.17 30.90 38.70 34.96 16.83 25.56 16.74Bhutan (2006) … … 15.45 8.00 50.50 18.61 … 43.60 … 46.74 4.70 7.93Cameroon (2005) 0.15 5.37 4.16 9.26 22.37 52.06 76.90 60.60 … 44.56 9.77 …Congo, Rep. (2005) 0.07 3.16 9.34 2.35 48.78 6.54 … … … 47.32 … 6.24Côte d’Ivoire (2008) 0.06 3.14 7.45 0.90 95.05 9.95 … … 36.89 48.39 … 15.48Georgia (2003) … 2.57 0.00 3.72 0.01 11.66 … 53.40 … 40.80 … 17.72India (2007) 2.04 11.16 0.45 0.12 1.82 0.30 … … … 36.80 10.11 12.39Indonesia (2003) 3.14 5.31 1.57 0.24 4.89 0.83 55.90 41.20 … 37.58 17.75 12.33Lesotho (2005) 1.12 5.31 14.84 6.17 42.92 31.73 … … 57.94 52.50 37.41 54.37Moldova (2005) 2.78 3.48 … 5.54 … 15.91 33.80 32.80 34.32 37.35 … 20.57Mongolia (2007) 0.57 6.24 0.70 6.23 1.75 15.09 39.50 37.70 33.20 36.57 13.15 25.30Nicaragua (2005) 2.18 2.74 33.36 15.02 169.37 46.19 39.30 29.10 56.38 52.33 26.27 17.97Nigeria (2008) 5.03 10.93 1.00 1.27 … … 46.90 … 44.95 42.93 … …Pakistan (2008) 1.10 4.44 2.70 1.54 14.87 6.96 51.10 43.60 33.23 31.18 13.32 9.84Sao Tome and … 5.50 … 23.82 … … 39.90 27.90 … 50.60 … …Principe (2008)Senegal (2009) 0.13 3.55 14.70 7.77 155.36 24.94 … 33.70 54.14 39.19 … 16.12Solomon Islands 1.29 3.85 22.02 48.83 74.49 306.74 … … … … … …(2008)Sudan (2007) 0.13 1.26 7.13 5.07 58.53 18.84 … … … … … …Timor-Leste (2007) … … … 16.10 … … … … … 31.92 … …Turkmenistan (2000) … … 0.95 0.33 2.59 8.82 … … 26.17 … … …Tuvalu (2009) … … … … … … … … … … … …Ukraine (2002) 0.43 5.10 … 0.30 … 1.10 … 11.00 42.33 47.06 16.20 17.77Uzbekistan (2009) … … 0.48 0.76 2.41 3.91 41.20 … 24.95 36.72 … …Vietnam (2009) … 4.08 2.98 3.77 22.20 8.48 … 57.90 35.68 37.77Yemen (2009) 2.05 8.39 8.34 1.04 56.92 8.71 52.60 … 39.45 37.69 10.86Average forcountries with 2 1.3 5.0 7.0 5.8 40.4 28.4 45.9 39.0 40.6 39.7 18.3 19.4data pointsSource: WDI40


