

Andy Sumner - Institute of Development Studies
Andy Sumner - Institute of Development Studies
Andy Sumner - Institute of Development Studies

You also want an ePaper? Increase the reach of your titles
YUMPU automatically turns print PDFs into web optimized ePapers that Google loves.
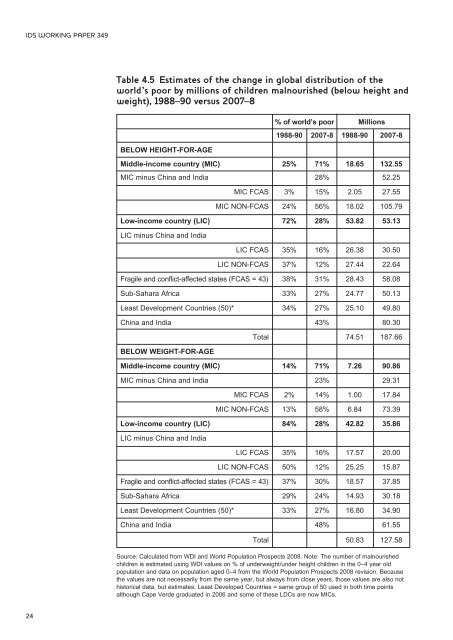
IDS WORKING PAPER 349Table 4.5 Estimates <strong>of</strong> the change in global distribution <strong>of</strong> theworld’s poor by millions <strong>of</strong> children malnourished (below height andweight), 1988–90 versus 2007–8BELOW HEIGHT-FOR-AGE% <strong>of</strong> world’s poor Millions1988-90 2007-8 1988-90 2007-8Middle-income country (MIC) 25% 71% 18.65 132.55MIC minus China and India 28% 52.25MIC FCAS 3% 15% 2.05 27.55MIC NON-FCAS 24% 56% 18.02 105.79Low-income country (LIC) 72% 28% 53.82 53.13LIC minus China and IndiaLIC FCAS 35% 16% 26.38 30.50LIC NON-FCAS 37% 12% 27.44 22.64Fragile and conflict-affected states (FCAS = 43) 38% 31% 28.43 58.08Sub-Sahara Africa 33% 27% 24.77 50.13Least <strong>Development</strong> Countries (50)* 34% 27% 25.10 49.80China and India 43% 80.30BELOW WEIGHT-FOR-AGETotal 74.51 187.66Middle-income country (MIC) 14% 71% 7.26 90.86MIC minus China and India 23% 29.31MIC FCAS 2% 14% 1.00 17.84MIC NON-FCAS 13% 58% 6.84 73.39Low-income country (LIC) 84% 28% 42.82 35.86LIC minus China and IndiaLIC FCAS 35% 16% 17.57 20.00LIC NON-FCAS 50% 12% 25.25 15.87Fragile and conflict-affected states (FCAS = 43) 37% 30% 18.57 37.85Sub-Sahara Africa 29% 24% 14.93 30.18Least <strong>Development</strong> Countries (50)* 33% 27% 16.80 34.90China and India 48% 61.55Total 50.83 127.58Source: Calculated from WDI and World Population Prospects 2008. Note: The number <strong>of</strong> malnourishedchildren is estimated using WDI values on % <strong>of</strong> underweight/under height children in the 0–4 year oldpopulation and data on population aged 0–4 from the World Population Prospects 2008 revision. Becausethe values are not necessarily from the same year, but always from close years, those values are also nothistorical data, but estimates; Least Developed Countries = same group <strong>of</strong> 50 used in both time pointsalthough Cape Verde graduated in 2006 and some <strong>of</strong> these LDCs are now MICs.24


