

Andy Sumner - Institute of Development Studies
Andy Sumner - Institute of Development Studies
Andy Sumner - Institute of Development Studies

You also want an ePaper? Increase the reach of your titles
YUMPU automatically turns print PDFs into web optimized ePapers that Google loves.
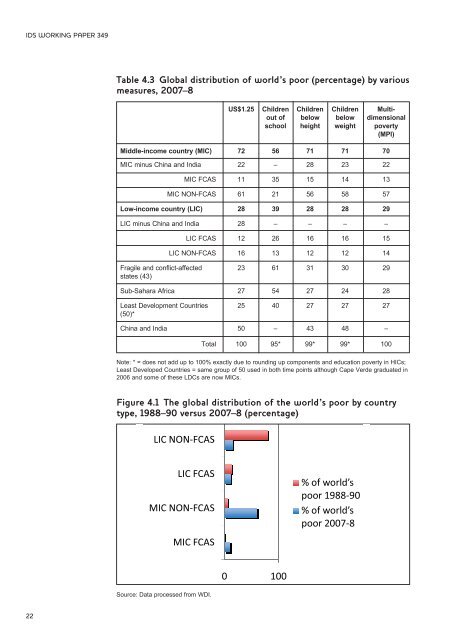
IDS WORKING PAPER 349Table 4.3 Global distribution <strong>of</strong> world’s poor (percentage) by variousmeasures, 2007–8US$1.25 Children Children Children Multiout<strong>of</strong> below below dimensionalschool height weight poverty(MPI)Middle-income country (MIC) 72 56 71 71 70MIC minus China and India 22 – 28 23 22MIC FCAS 11 35 15 14 13MIC NON-FCAS 61 21 56 58 57Low-income country (LIC) 28 39 28 28 29LIC minus China and India 28 – – – –LIC FCAS 12 26 16 16 15LIC NON-FCAS 16 13 12 12 14Fragile and conflict-affected 23 61 31 30 29states (43)Sub-Sahara Africa 27 54 27 24 28Least <strong>Development</strong> Countries 25 40 27 27 27(50)*China and India 50 – 43 48 –Total 100 95* 99* 99* 100Note: * = does not add up to 100% exactly due to rounding up components and education poverty in HICs;Least Developed Countries = same group <strong>of</strong> 50 used in both time points although Cape Verde graduated in2006 and some <strong>of</strong> these LDCs are now MICs.Figure 4.1 The global distribution <strong>of</strong> the world’s poor by countrytype, 1988–90 versus 2007–8 (percentage)Source: Data processed from WDI.22


