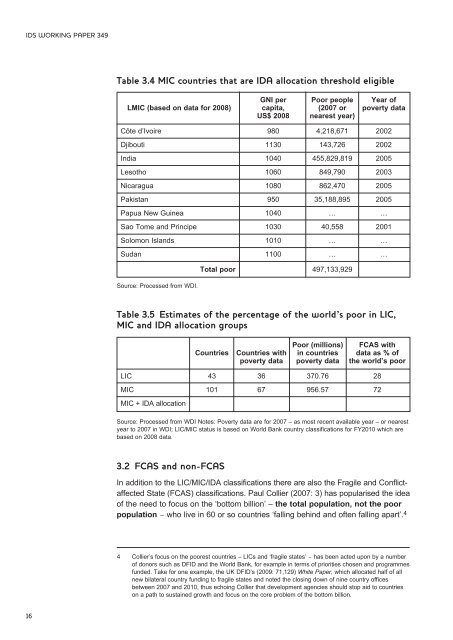
IDS WORKING PAPER 349Table 3.4 MIC countries that are IDA allocation threshold eligibleGNI per Poor people Year <strong>of</strong>LMIC (based on data for 2008) capita, (2007 or poverty dataUS$ 2008 nearest year)Côte d’Ivoire 980 4,218,671 2002Djibouti 1130 143,726 2002India 1040 455,829,819 2005Lesotho 1060 849,790 2003Nicaragua 1080 862,470 2005Pakistan 950 35,188,895 2005Papua New Guinea 1040 … …Sao Tome and Principe 1030 40,558 2001Solomon Islands 1010 … …Sudan 1100 … …Source: Processed from WDI.Total poor 497,133,929Table 3.5 Estimates <strong>of</strong> the percentage <strong>of</strong> the world’s poor in LIC,MIC and IDA allocation groupsPoor (millions) FCAS withCountries Countries with in countries data as % <strong>of</strong>poverty data poverty data the world’s poorLIC 43 36 370.76 28MIC 101 67 956.57 72MIC + IDA allocationSource: Processed from WDI Notes: Poverty data are for 2007 – as most recent available year – or nearestyear to 2007 in WDI; LIC/MIC status is based on World Bank country classifications for FY2010 which arebased on 2008 data.3.2 FCAS and non-FCASIn addition to the LIC/MIC/IDA classifications there are also the Fragile and ConflictaffectedState (FCAS) classifications. Paul Collier (2007: 3) has popularised the idea<strong>of</strong> the need to focus on the ‘bottom billion’ – the total population, not the poorpopulation − who live in 60 or so countries ‘falling behind and <strong>of</strong>ten falling apart’. 44 Collier’s focus on the poorest countries – LICs and ‘fragile states’ − has been acted upon by a number<strong>of</strong> donors such as DFID and the World Bank, for example in terms <strong>of</strong> priorities chosen and programmesfunded. Take for one example, the UK DFID’s (2009: 71,129) White Paper, which allocated half <strong>of</strong> allnew bilateral country funding to fragile states and noted the closing down <strong>of</strong> nine country <strong>of</strong>ficesbetween 2007 and 2010, thus echoing Collier that development agencies should stop aid to countrieson a path to sustained growth and focus on the core problem <strong>of</strong> the bottom billion.16
IDS WORKING PAPER 349It is true that fragile states are more <strong>of</strong>f-track on the MDGs than other types <strong>of</strong>developing countries (UNDP 2009). In 2010 the WDR will present data showingthat much <strong>of</strong> the ‘<strong>of</strong>f-trackness’ <strong>of</strong> MDGs is accounted for by FCAS. However,when it comes to finding the poor, the picture is a bit more complicated. Fragilestates are significant to global poverty, but so are populous developingcountries. 5The classification <strong>of</strong> FCAS is complex. Stewart and Brown (2009) review variousdefinitions and conclude FCAS are framed by three failures – failures <strong>of</strong> authority,failures <strong>of</strong> service delivery, and failures <strong>of</strong> legitimacy (2009: 3–4). However, thereis no ‘<strong>of</strong>ficial’ or agreed list <strong>of</strong> FCAS (DFID and OECD DAC, for example, do notpublish ‘<strong>of</strong>ficial’ lists but keep informal ones). There are three lists that one mightcall academic lists, or indices commonly referred to, which produce different lists<strong>of</strong> countries. These are the World Bank’s Country Policy and InstitutionalAssessment (CPIA) index, the Brookings Index <strong>of</strong> State Weakness in theDeveloping World 2009, and the Carleton University Country Indicators forForeign Policy (CIFP) 2008 index (see Annex I). These lists are not consistent. Onthe one hand, if we consider these lists together, there are just 17 FCAS commonto the three lists. On the other hand, aggregating the lists creates a list <strong>of</strong> 43FCAS (see Annex I). The list <strong>of</strong> 43 was used in OECD (2010) Resource Flows toFCAS, and the European Report on <strong>Development</strong> (2009) applied the sameaggregating methodology to Africa. 6An alternative definition <strong>of</strong> FCAS would differentiate on the basis <strong>of</strong> the extent <strong>of</strong>fragility. The quickest (and crudest) way to produce this would be a ‘wisdom <strong>of</strong>crowds approach’ and thus:●●higher fragility = country on all three lists (N = 17);low or medium fragility = country on one or more list (N = 26);This raises a question mark over the <strong>of</strong>t-cited figure that a third <strong>of</strong> the world’s poorlive in fragile states. Does it refer to one list, 17 or 43 countries? The mathematicalbasis <strong>of</strong> this figure is somewhat <strong>of</strong> a mystery (the author has asked a number <strong>of</strong>relevant academics and policy people).We can then estimate how many poor people live in FCAS by various definitions(see Section 4 below for full details and for quick reference see Tables 3.6 and 3.7).If we take the FCAS common to all lists we get just 6 per cent <strong>of</strong> the world’s poor.5 For example, The Lancet estimated just six countries account for 50 per cent <strong>of</strong> under-5 mortality (U5M)(over 5 million children). These are a mix <strong>of</strong> fragile and non-fragile populous countries: India, Nigeria,Democratic Republic <strong>of</strong> Congo, Ethiopia, Pakistan and China (and 42 countries account for 90 per cent<strong>of</strong> U5M – Bryce et al. 2005). Similarly, maternal deaths are concentrated in 11 countries, which accountfor 65 per cent <strong>of</strong> all maternal deaths (348,400 women). Again, many are fragile states but some arenot: India, Nigeria, DRC, Afghanistan, Ethiopia, Bangladesh, Indonesia, Pakistan, Niger, Tanzania andAngola (WHO/UNICEF/UNFPA/World Bank 2007). Both sets <strong>of</strong> estimates were recently andcontentiously revised (see Hogan et al. 2010; You et al. 2010).6 When Harttgen and Klasen (2010) assessed the usefulness <strong>of</strong> the concept <strong>of</strong> ‘fragility’ and how listsdiffer, they concluded that the heterogeneity <strong>of</strong> countries under various FCAS classifications is so greatit is not useful to treat them as a group as the problems they face and the solutions differ greatly.17