

Andy Sumner - Institute of Development Studies
Andy Sumner - Institute of Development Studies
Andy Sumner - Institute of Development Studies

You also want an ePaper? Increase the reach of your titles
YUMPU automatically turns print PDFs into web optimized ePapers that Google loves.
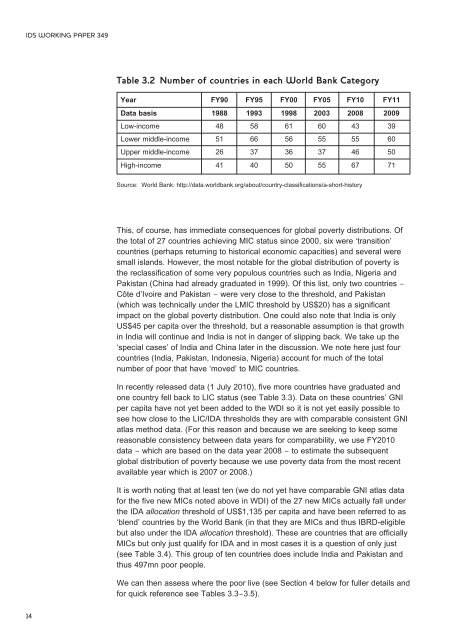
IDS WORKING PAPER 349Table 3.2 Number <strong>of</strong> countries in each World Bank CategoryYear FY90 FY95 FY00 FY05 FY10 FY11Data basis 1988 1993 1998 2003 2008 2009Low-income 48 58 61 60 43 39Lower middle-income 51 66 56 55 55 60Upper middle-income 26 37 36 37 46 50High-income 41 40 50 55 67 71Source: World Bank: http://data.worldbank.org/about/country-classifications/a-short-historyThis, <strong>of</strong> course, has immediate consequences for global poverty distributions. Ofthe total <strong>of</strong> 27 countries achieving MIC status since 2000, six were ‘transition’countries (perhaps returning to historical economic capacities) and several weresmall islands. However, the most notable for the global distribution <strong>of</strong> poverty isthe reclassification <strong>of</strong> some very populous countries such as India, Nigeria andPakistan (China had already graduated in 1999). Of this list, only two countries −Côte d’Ivoire and Pakistan − were very close to the threshold, and Pakistan(which was technically under the LMIC threshold by US$20) has a significantimpact on the global poverty distribution. One could also note that India is onlyUS$45 per capita over the threshold, but a reasonable assumption is that growthin India will continue and India is not in danger <strong>of</strong> slipping back. We take up the‘special cases’ <strong>of</strong> India and China later in the discussion. We note here just fourcountries (India, Pakistan, Indonesia, Nigeria) account for much <strong>of</strong> the totalnumber <strong>of</strong> poor that have ‘moved’ to MIC countries.In recently released data (1 July 2010), five more countries have graduated andone country fell back to LIC status (see Table 3.3). Data on these countries’ GNIper capita have not yet been added to the WDI so it is not yet easily possible tosee how close to the LIC/IDA thresholds they are with comparable consistent GNIatlas method data. (For this reason and because we are seeking to keep somereasonable consistency between data years for comparability, we use FY2010data − which are based on the data year 2008 − to estimate the subsequentglobal distribution <strong>of</strong> poverty because we use poverty data from the most recentavailable year which is 2007 or 2008.)It is worth noting that at least ten (we do not yet have comparable GNI atlas datafor the five new MICs noted above in WDI) <strong>of</strong> the 27 new MICs actually fall underthe IDA allocation threshold <strong>of</strong> US$1,135 per capita and have been referred to as‘blend’ countries by the World Bank (in that they are MICs and thus IBRD-eligiblebut also under the IDA allocation threshold). These are countries that are <strong>of</strong>ficiallyMICs but only just qualify for IDA and in most cases it is a question <strong>of</strong> only just(see Table 3.4). This group <strong>of</strong> ten countries does include India and Pakistan andthus 497mn poor people.We can then assess where the poor live (see Section 4 below for fuller details andfor quick reference see Tables 3.3−3.5).14


