

Andy Sumner - Institute of Development Studies
Andy Sumner - Institute of Development Studies
Andy Sumner - Institute of Development Studies

Create successful ePaper yourself
Turn your PDF publications into a flip-book with our unique Google optimized e-Paper software.
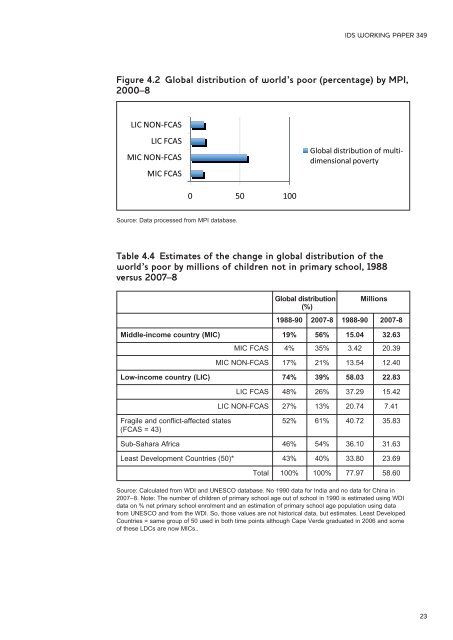
IDS WORKING PAPER 349Figure 4.2 Global distribution <strong>of</strong> world’s poor (percentage) by MPI,2000–8Source: Data processed from MPI database.Table 4.4 Estimates <strong>of</strong> the change in global distribution <strong>of</strong> theworld’s poor by millions <strong>of</strong> children not in primary school, 1988versus 2007–8Global distribution(%)Millions1988-90 2007-8 1988-90 2007-8Middle-income country (MIC) 19% 56% 15.04 32.63MIC FCAS 4% 35% 3.42 20.39MIC NON-FCAS 17% 21% 13.54 12.40Low-income country (LIC) 74% 39% 58.03 22.83LIC FCAS 48% 26% 37.29 15.42LIC NON-FCAS 27% 13% 20.74 7.41Fragile and conflict-affected states 52% 61% 40.72 35.83(FCAS = 43)Sub-Sahara Africa 46% 54% 36.10 31.63Least <strong>Development</strong> Countries (50)* 43% 40% 33.80 23.69Total 100% 100% 77.97 58.60Source: Calculated from WDI and UNESCO database. No 1990 data for India and no data for China in2007–8. Note: The number <strong>of</strong> children <strong>of</strong> primary school age out <strong>of</strong> school in 1990 is estimated using WDIdata on % net primary school enrolment and an estimation <strong>of</strong> primary school age population using datafrom UNESCO and from the WDI. So, those values are not historical data, but estimates. Least DevelopedCountries = same group <strong>of</strong> 50 used in both time points although Cape Verde graduated in 2006 and some<strong>of</strong> these LDCs are now MICs..23


