

Domestic Air Cargo Industry in Australia - Bureau of Infrastructure ...
Domestic Air Cargo Industry in Australia - Bureau of Infrastructure ...
Domestic Air Cargo Industry in Australia - Bureau of Infrastructure ...

You also want an ePaper? Increase the reach of your titles
YUMPU automatically turns print PDFs into web optimized ePapers that Google loves.
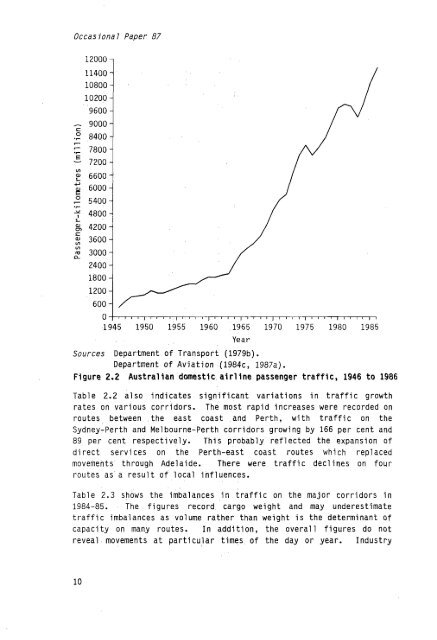
Occasional Paper 871200011400108001020096009000c.," 84007800-7E7200v)2 6600c,g 60002 .- 5400l4800L8 4200SQJ v) 3600a 300012006001945 1950 1955 1960 1965 1970 1975 1980 1985YearSources Department <strong>of</strong> Transport (1979b).Department <strong>of</strong> Aviation (1984~~ 1987a).Figure 2.2 <strong>Australia</strong>n domestic airl<strong>in</strong>e passenger traffic, 1946 to 1986Table 2.2 also <strong>in</strong>dicates significant variations<strong>in</strong> traffic growthrates on various corridors. The most rapid <strong>in</strong>creases were recorded onroutes between the east coast and Perth, with traffic on theSydney-Perth and Melbourne-Perth corridors grow<strong>in</strong>g by 166 per cent and89 per cent respectively. This probably reflected the expansion <strong>of</strong>direct services on the Perth-east coast routes which replacedmovements through Adelaide. There were traffic decl<strong>in</strong>eson fourroutes as' a result <strong>of</strong> local <strong>in</strong>fluences.Table 2.3 shows the imbalances <strong>in</strong> traffic on the major corridors <strong>in</strong>1984-85. The figures record cargo weight and may underestimatetraffic imbalances as volume rather than weight is the determ<strong>in</strong>ant <strong>of</strong>capacity on many routes. In addition, the overall figures do notreveal movements at particular times <strong>of</strong> the day or year. <strong>Industry</strong>10


