fra-2014-being-trans-eu-comparative_en
fra-2014-being-trans-eu-comparative_en
fra-2014-being-trans-eu-comparative_en

Create successful ePaper yourself
Turn your PDF publications into a flip-book with our unique Google optimized e-Paper software.
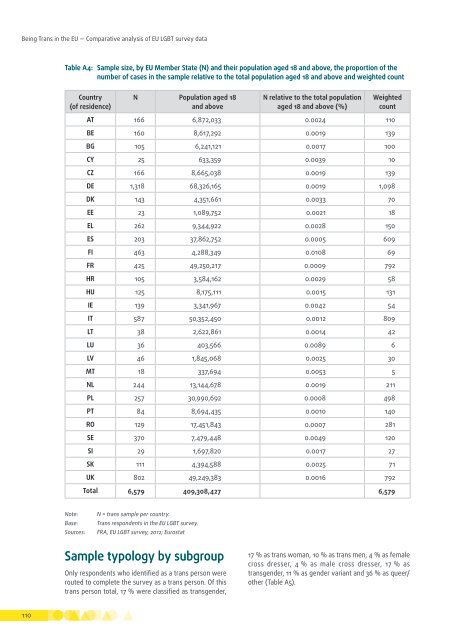
Being Trans in the EU — Comparative analysis of EU LGBT survey dataTable A4: Sample size, by EU Member State (N) and their population aged 18 and above, the proportion of th<strong>en</strong>umber of cases in the sample relative to the total population aged 18 and above and weighted countCountry(of resid<strong>en</strong>ce)N Population aged 18and aboveN relative to the total populationaged 18 and above (%)WeightedcountAT 166 6,872,033 0.0024 110BE 160 8,617,292 0.0019 139BG 105 6,241,121 0.0017 100CY 25 633,359 0.0039 10CZ 166 8,665,038 0.0019 139DE 1,318 68,326,165 0.0019 1,098DK 143 4,351,661 0.0033 70EE 23 1,089,752 0.0021 18EL 262 9,344,922 0.0028 150ES 203 37,862,752 0.0005 609FI 463 4,288,349 0.0108 69FR 425 49,250,217 0.0009 792HR 105 3,584,162 0.0029 58HU 125 8,175,111 0.0015 131IE 139 3,341,967 0.0042 54IT 587 50,352,450 0.0012 809LT 38 2,622,861 0.0014 42LU 36 403,566 0.0089 6LV 46 1,845,068 0.0025 30MT 18 337,694 0.0053 5NL 244 13,144,678 0.0019 211PL 257 30,990,692 0.0008 498PT 84 8,694,435 0.0010 140RO 129 17,451,843 0.0007 281SE 370 7,479,448 0.0049 120SI 29 1,697,820 0.0017 27SK 111 4,394,588 0.0025 71UK 802 49,249,383 0.0016 792Total 6,579 409,308,427 6,579Note:Base:Sources:N = <strong>trans</strong> sample per country.Trans respond<strong>en</strong>ts in the EU LGBT survey.FRA, EU LGBT survey, 2012; EurostatSample typology by subgroupOnly respond<strong>en</strong>ts who id<strong>en</strong>tified as a <strong>trans</strong> person wererouted to complete the survey as a <strong>trans</strong> person. Of this<strong>trans</strong> person total, 17 % were classified as <strong>trans</strong>g<strong>en</strong>der,17 % as <strong>trans</strong> woman, 10 % as <strong>trans</strong> m<strong>en</strong>, 4 % as femalecross dresser, 4 % as male cross dresser, 17 % as<strong>trans</strong>g<strong>en</strong>der, 11 % as g<strong>en</strong>der variant and 36 % as queer/other (Table A5).110