fra-2014-being-trans-eu-comparative_en
fra-2014-being-trans-eu-comparative_en
fra-2014-being-trans-eu-comparative_en
Create successful ePaper yourself
Turn your PDF publications into a flip-book with our unique Google optimized e-Paper software.
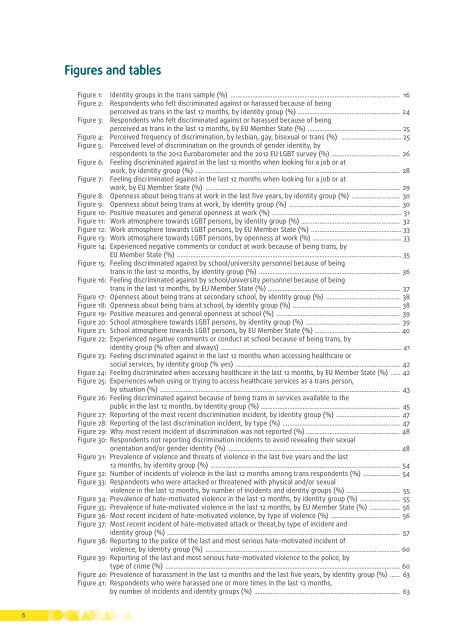
Figures and tablesFigure 1: Id<strong>en</strong>tity groups in the <strong>trans</strong> sample (%) ..................................................................................................... 16Figure 2: Respond<strong>en</strong>ts who felt discriminated against or harassed because of <strong>being</strong>perceived as <strong>trans</strong> in the last 12 months, by id<strong>en</strong>tity group (%) ............................................................. 24Figure 3: Respond<strong>en</strong>ts who felt discriminated against or harassed because of <strong>being</strong>perceived as <strong>trans</strong> in the last 12 months, by EU Member State (%) ........................................................ 25Figure 4: Perceived frequ<strong>en</strong>cy of discrimination, by lesbian, gay, bisexual or <strong>trans</strong> (%) .................................... 25Figure 5: Perceived level of discrimination on the grounds of g<strong>en</strong>der id<strong>en</strong>tity, byrespond<strong>en</strong>ts to the 2012 Eurobarometer and the 2012 EU LGBT survey (%) ......................................... 26Figure 6: Feeling discriminated against in the last 12 months wh<strong>en</strong> looking for a job or atwork, by id<strong>en</strong>tity group (%) .......................................................................................................................... 28Figure 7: Feeling discriminated against in the last 12 months wh<strong>en</strong> looking for a job or atwork, by EU Member State (%) .................................................................................................................... 29Figure 8: Op<strong>en</strong>ness about <strong>being</strong> <strong>trans</strong> at work in the last five years, by id<strong>en</strong>tity group (%) ............................. 30Figure 9: Op<strong>en</strong>ness about <strong>being</strong> <strong>trans</strong> at work, by id<strong>en</strong>tity group (%) .................................................................. 30Figure 10: Positive measures and g<strong>en</strong>eral op<strong>en</strong>ness at work (%) ............................................................................. 31Figure 11: Work atmosphere towards LGBT persons, by id<strong>en</strong>tity group (%) ........................................................... 32Figure 12: Work atmosphere towards LGBT persons, by EU Member State (%) ...................................................... 33Figure 13: Work atmosphere towards LGBT persons, by op<strong>en</strong>ness at work (%) ..................................................... 33Figure 14: Experi<strong>en</strong>ced negative comm<strong>en</strong>ts or conduct at work because of <strong>being</strong> <strong>trans</strong>, byEU Member State (%) ...................................................................................................................................... 35Figure 15: Feeling discriminated against by school/university personnel because of <strong>being</strong><strong>trans</strong> in the last 12 months, by id<strong>en</strong>tity group (%) .................................................................................... 36Figure 16: Feeling discriminated against by school/university personnel because of <strong>being</strong><strong>trans</strong> in the last 12 months, by EU Member State (%) ............................................................................... 37Figure 17: Op<strong>en</strong>ness about <strong>being</strong> <strong>trans</strong> at secondary school, by id<strong>en</strong>tity group (%) ............................................ 38Figure 18: Op<strong>en</strong>ness about <strong>being</strong> <strong>trans</strong> at school, by id<strong>en</strong>tity group (%) ................................................................ 38Figure 19: Positive measures and g<strong>en</strong>eral op<strong>en</strong>ness at school (%) .......................................................................... 39Figure 20: School atmosphere towards LGBT persons, by id<strong>en</strong>tity group (%) ........................................................ 39Figure 21: School atmosphere towards LGBT persons, by EU Member State (%) ................................................... 40Figure 22: Experi<strong>en</strong>ced negative comm<strong>en</strong>ts or conduct at school because of <strong>being</strong> <strong>trans</strong>, byid<strong>en</strong>tity group (% oft<strong>en</strong> and always) ............................................................................................................ 41Figure 23: Feeling discriminated against in the last 12 months wh<strong>en</strong> accessing healthcare orsocial services, by id<strong>en</strong>tity group (% yes) .................................................................................................. 42Figure 24: Feeling discriminated wh<strong>en</strong> accessing healthcare in the last 12 months, by EU Member State (%) ...... 42Figure 25: Experi<strong>en</strong>ces wh<strong>en</strong> using or trying to access healthcare services as a <strong>trans</strong> person,by situation (%) ............................................................................................................................................... 43Figure 26: Feeling discriminated against because of <strong>being</strong> <strong>trans</strong> in services available to thepublic in the last 12 months, by id<strong>en</strong>tity group (%) ................................................................................... 45Figure 27: Reporting of the most rec<strong>en</strong>t discrimination incid<strong>en</strong>t, by id<strong>en</strong>tity group (%) ...................................... 47Figure 28: Reporting of the last discrimination incid<strong>en</strong>t, by type (%) ...................................................................... 47Figure 29: Why most rec<strong>en</strong>t incid<strong>en</strong>t of discrimination was not reported (%) ........................................................ 48Figure 30: Respond<strong>en</strong>ts not reporting discrimination incid<strong>en</strong>ts to avoid revealing their sexualori<strong>en</strong>tation and/or g<strong>en</strong>der id<strong>en</strong>tity (%) ....................................................................................................... 48Figure 31: Preval<strong>en</strong>ce of viol<strong>en</strong>ce and threats of viol<strong>en</strong>ce in the last five years and the last12 months, by id<strong>en</strong>tity group (%) ................................................................................................................. 54Figure 32: Number of incid<strong>en</strong>ts of viol<strong>en</strong>ce in the last 12 months among <strong>trans</strong> respond<strong>en</strong>ts (%) ...................... 54Figure 33: Respond<strong>en</strong>ts who were attacked or threat<strong>en</strong>ed with physical and/or sexualviol<strong>en</strong>ce in the last 12 months, by number of incid<strong>en</strong>ts and id<strong>en</strong>tity groups (%) ................................ 55Figure 34: Preval<strong>en</strong>ce of hate‐motivated viol<strong>en</strong>ce in the last 12 months, by id<strong>en</strong>tity group (%) ........................ 55Figure 35: Preval<strong>en</strong>ce of hate‐motivated viol<strong>en</strong>ce in the last 12 months, by EU Member State (%) .................. 56Figure 36: Most rec<strong>en</strong>t incid<strong>en</strong>t of hate‐motivated viol<strong>en</strong>ce, by type of viol<strong>en</strong>ce (%) ......................................... 56Figure 37: Most rec<strong>en</strong>t incid<strong>en</strong>t of hate‐motivated attack or threat,by type of incid<strong>en</strong>t andid<strong>en</strong>tity group (%) ........................................................................................................................................... 57Figure 38: Reporting to the police of the last and most serious hate‐motivated incid<strong>en</strong>t ofviol<strong>en</strong>ce, by id<strong>en</strong>tity group (%) .................................................................................................................... 60Figure 39: Reporting of the last and most serious hate‐motivated viol<strong>en</strong>ce to the police, bytype of crime (%) ............................................................................................................................................ 60Figure 40: Preval<strong>en</strong>ce of harassm<strong>en</strong>t in the last 12 months and the last five years, by id<strong>en</strong>tity group (%) ...... 63Figure 41: Respond<strong>en</strong>ts who were harassed one or more times in the last 12 months,by number of incid<strong>en</strong>ts and id<strong>en</strong>tity groups (%) ....................................................................................... 636


