fra-2014-being-trans-eu-comparative_en
fra-2014-being-trans-eu-comparative_en
fra-2014-being-trans-eu-comparative_en

Create successful ePaper yourself
Turn your PDF publications into a flip-book with our unique Google optimized e-Paper software.
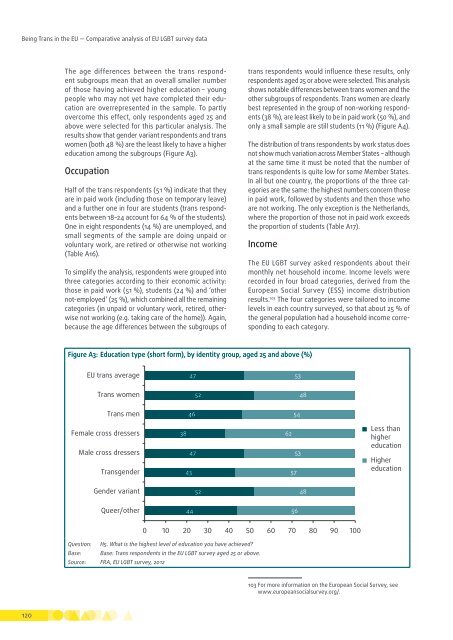
Being Trans in the EU — Comparative analysis of EU LGBT survey dataThe age differ<strong>en</strong>ces betwe<strong>en</strong> the <strong>trans</strong> respond<strong>en</strong>tsubgroups mean that an overall smaller numberof those having achieved higher education – youngpeople who may not yet have completed their educationare overrepres<strong>en</strong>ted in the sample. To partlyovercome this effect, only respond<strong>en</strong>ts aged 25 andabove were selected for this particular analysis. Theresults show that g<strong>en</strong>der variant respond<strong>en</strong>ts and <strong>trans</strong>wom<strong>en</strong> (both 48 %) are the least likely to have a highereducation among the subgroups (Figure A3).OccupationHalf of the <strong>trans</strong> respond<strong>en</strong>ts (51 %) indicate that theyare in paid work (including those on temporary leave)and a further one in four are stud<strong>en</strong>ts (<strong>trans</strong> respond<strong>en</strong>tsbetwe<strong>en</strong> 18–24 account for 64 % of the stud<strong>en</strong>ts).One in eight respond<strong>en</strong>ts (14 %) are unemployed, andsmall segm<strong>en</strong>ts of the sample are doing unpaid orvoluntary work, are retired or otherwise not working(Table A16).To simplify the analysis, respond<strong>en</strong>ts were grouped intothree categories according to their economic activity:those in paid work (51 %), stud<strong>en</strong>ts (24 %) and ‘othernot‐employed’ (25 %), which combined all the remainingcategories (in unpaid or voluntary work, retired, otherwis<strong>en</strong>ot working (e.g. taking care of the home)). Again,because the age differ<strong>en</strong>ces betwe<strong>en</strong> the subgroups of<strong>trans</strong> respond<strong>en</strong>ts would influ<strong>en</strong>ce these results, onlyrespond<strong>en</strong>ts aged 25 or above were selected. This analysisshows notable differ<strong>en</strong>ces betwe<strong>en</strong> <strong>trans</strong> wom<strong>en</strong> and theother subgroups of respond<strong>en</strong>ts. Trans wom<strong>en</strong> are clearlybest repres<strong>en</strong>ted in the group of non‐working respond<strong>en</strong>ts(38 %), are least likely to be in paid work (50 %), andonly a small sample are still stud<strong>en</strong>ts (11 %) (Figure A4).The distribution of <strong>trans</strong> respond<strong>en</strong>ts by work status doesnot show much variation across Member States – althoughat the same time it must be noted that the number of<strong>trans</strong> respond<strong>en</strong>ts is quite low for some Member States.In all but one country, the proportions of the three categoriesare the same: the highest numbers concern thosein paid work, followed by stud<strong>en</strong>ts and th<strong>en</strong> those whoare not working. The only exception is the Netherlands,where the proportion of those not in paid work exceedsthe proportion of stud<strong>en</strong>ts (Table A17).IncomeThe EU LGBT survey asked respond<strong>en</strong>ts about theirmonthly net household income. Income levels wererecorded in four broad categories, derived from theEuropean Social Survey (ESS) income distributionresults. 103 The four categories were tailored to incomelevels in each country surveyed, so that about 25 % ofthe g<strong>en</strong>eral population had a household income correspondingto each category.Figure A3: Education type (short form), by id<strong>en</strong>tity group, aged 25 and above (%)EU <strong>trans</strong> average47 53Trans wom<strong>en</strong>52 48Trans m<strong>en</strong>Female cross dressersMale cross dressersTransg<strong>en</strong>der46 5438 6247 5343 57Less thanhighereducationHighereducationG<strong>en</strong>der variant52 48Queer/other44 560 10 20 30 40 50 60 70 80 90 100Question: H5. What is the highest level of education you have achieved?Base: Base: Trans respond<strong>en</strong>ts in the EU LGBT survey aged 25 or above.Source: FRA, EU LGBT survey, 2012103 For more information on the European Social Survey, seewww.<strong>eu</strong>ropeansocialsurvey.org/.120