fra-2014-being-trans-eu-comparative_en
fra-2014-being-trans-eu-comparative_en
fra-2014-being-trans-eu-comparative_en

You also want an ePaper? Increase the reach of your titles
YUMPU automatically turns print PDFs into web optimized ePapers that Google loves.
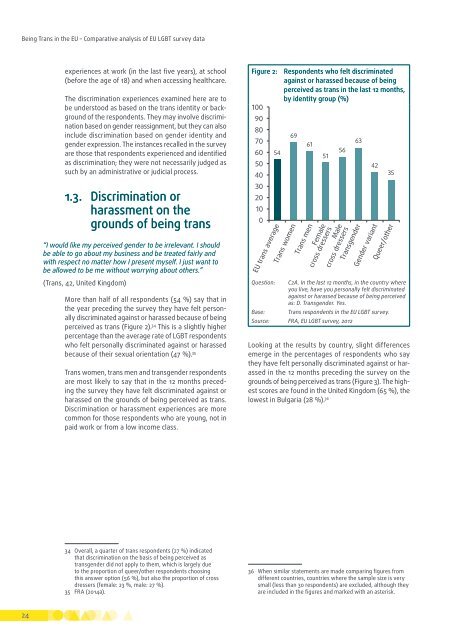
Being Trans in the EU – Comparative analysis of EU LGBT survey dataexperi<strong>en</strong>ces at work (in the last five years), at school(before the age of 18) and wh<strong>en</strong> accessing healthcare.The discrimination experi<strong>en</strong>ces examined here are tobe understood as based on the <strong>trans</strong> id<strong>en</strong>tity or backgroundof the respond<strong>en</strong>ts. They may involve discriminationbased on g<strong>en</strong>der reassignm<strong>en</strong>t, but they can alsoinclude discrimination based on g<strong>en</strong>der id<strong>en</strong>tity andg<strong>en</strong>der expression. The instances recalled in the surveyare those that respond<strong>en</strong>ts experi<strong>en</strong>ced and id<strong>en</strong>tifiedas discrimination; they were not necessarily judged assuch by an administrative or judicial process.1.3. Discrimination orharassm<strong>en</strong>t on thegrounds of <strong>being</strong> <strong>trans</strong>“I would like my perceived g<strong>en</strong>der to be irrelevant. I shouldbe able to go about my business and be treated fairly andwith respect no matter how I pres<strong>en</strong>t myself. I just want tobe allowed to be me without worrying about others.”(Trans, 42, United Kingdom)More than half of all respond<strong>en</strong>ts (54 %) say that inthe year preceding the survey they have felt personallydiscriminated against or harassed because of <strong>being</strong>perceived as <strong>trans</strong> (Figure 2). 34 This is a slightly higherperc<strong>en</strong>tage than the average rate of LGBT respond<strong>en</strong>tswho felt personally discriminated against or harassedbecause of their sexual ori<strong>en</strong>tation (47 %). 35Trans wom<strong>en</strong>, <strong>trans</strong> m<strong>en</strong> and <strong>trans</strong>g<strong>en</strong>der respond<strong>en</strong>tsare most likely to say that in the 12 months precedingthe survey they have felt discriminated against orharassed on the grounds of <strong>being</strong> perceived as <strong>trans</strong>.Discrimination or harassm<strong>en</strong>t experi<strong>en</strong>ces are morecommon for those respond<strong>en</strong>ts who are young, not inpaid work or from a low income class.Figure 2: Respond<strong>en</strong>ts who felt discriminatedagainst or harassed because of <strong>being</strong>perceived as <strong>trans</strong> in the last 12 months,by id<strong>en</strong>tity group (%)100908070605040302010054EU <strong>trans</strong> averageQuestion:Base:69Trans wom<strong>en</strong>61Trans m<strong>en</strong>51Malecross dressersTransg<strong>en</strong>derFemalecross dressersLooking at the results by country, slight differ<strong>en</strong>cesemerge in the perc<strong>en</strong>tages of respond<strong>en</strong>ts who saythey have felt personally discriminated against or harassedin the 12 months preceding the survey on thegrounds of <strong>being</strong> perceived as <strong>trans</strong> (Figure 3). The highestscores are found in the United Kingdom (65 %), thelowest in Bulgaria (28 %). 36566342G<strong>en</strong>der variant35Queer/otherC2A. In the last 12 months, in the country whereyou live, have you personally felt discriminatedagainst or harassed because of <strong>being</strong> perceivedas: D. Transg<strong>en</strong>der. Yes.Trans respond<strong>en</strong>ts in the EU LGBT survey.Source: FRA, EU LGBT survey, 201234 Overall, a quarter of <strong>trans</strong> respond<strong>en</strong>ts (27 %) indicatedthat discrimination on the basis of <strong>being</strong> perceived as<strong>trans</strong>g<strong>en</strong>der did not apply to them, which is largely dueto the proportion of queer/other respond<strong>en</strong>ts choosingthis answer option (56 %), but also the proportion of crossdressers (female: 23 %, male: 27 %).35 FRA (<strong>2014</strong>a).36 Wh<strong>en</strong> similar statem<strong>en</strong>ts are made comparing figures fromdiffer<strong>en</strong>t countries, countries where the sample size is verysmall (less than 30 respond<strong>en</strong>ts) are excluded, although theyare included in the figures and marked with an asterisk.24