Bottled Water Consumption: The Case of Italy - Wbiaus.org
Bottled Water Consumption: The Case of Italy - Wbiaus.org
Bottled Water Consumption: The Case of Italy - Wbiaus.org

Create successful ePaper yourself
Turn your PDF publications into a flip-book with our unique Google optimized e-Paper software.
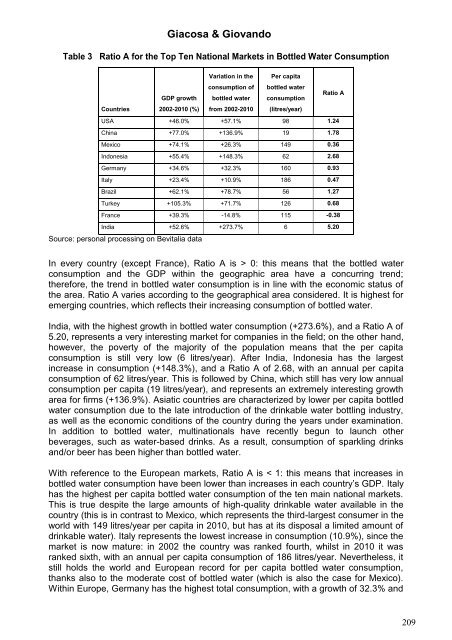
Giacosa & GiovandoTable 3 Ratio A for the Top Ten National Markets in <strong>Bottled</strong> <strong>Water</strong> <strong>Consumption</strong>Variation in the Per capitaconsumption <strong>of</strong> bottled waterGDP growth bottled water consumptionRatio ACountries 2002-2010 (%) from 2002-2010 (litres/year)USA +46.0% +57.1% 98 1.24China +77.0% +136.9% 19 1.78Mexico +74.1% +26.3% 149 0.36Indonesia +55.4% +148.3% 62 2.68Germany +34.6% +32.3% 160 0.93<strong>Italy</strong> +23.4% +10.9% 186 0.47Brazil +62.1% +78.7% 56 1.27Turkey +105.3% +71.7% 126 0.68France +39.3% -14.8% 115 -0.38India +52.6% +273.7% 6 5.20Source: personal processing on Bevitalia dataIn every country (except France), Ratio A is > 0: this means that the bottled waterconsumption and the GDP within the geographic area have a concurring trend;therefore, the trend in bottled water consumption is in line with the economic status <strong>of</strong>the area. Ratio A varies according to the geographical area considered. It is highest foremerging countries, which reflects their increasing consumption <strong>of</strong> bottled water.India, with the highest growth in bottled water consumption (+273.6%), and a Ratio A <strong>of</strong>5.20, represents a very interesting market for companies in the field; on the other hand,however, the poverty <strong>of</strong> the majority <strong>of</strong> the population means that the per capitaconsumption is still very low (6 litres/year). After India, Indonesia has the largestincrease in consumption (+148.3%), and a Ratio A <strong>of</strong> 2.68, with an annual per capitaconsumption <strong>of</strong> 62 litres/year. This is followed by China, which still has very low annualconsumption per capita (19 litres/year), and represents an extremely interesting growtharea for firms (+136.9%). Asiatic countries are characterized by lower per capita bottledwater consumption due to the late introduction <strong>of</strong> the drinkable water bottling industry,as well as the economic conditions <strong>of</strong> the country during the years under examination.In addition to bottled water, multinationals have recently begun to launch otherbeverages, such as water-based drinks. As a result, consumption <strong>of</strong> sparkling drinksand/or beer has been higher than bottled water.With reference to the European markets, Ratio A is < 1: this means that increases inbottled water consumption have been lower than increases in each country’s GDP. <strong>Italy</strong>has the highest per capita bottled water consumption <strong>of</strong> the ten main national markets.This is true despite the large amounts <strong>of</strong> high-quality drinkable water available in thecountry (this is in contrast to Mexico, which represents the third-largest consumer in theworld with 149 litres/year per capita in 2010, but has at its disposal a limited amount <strong>of</strong>drinkable water). <strong>Italy</strong> represents the lowest increase in consumption (10.9%), since themarket is now mature: in 2002 the country was ranked fourth, whilst in 2010 it wasranked sixth, with an annual per capita consumption <strong>of</strong> 186 litres/year. Nevertheless, itstill holds the world and European record for per capita bottled water consumption,thanks also to the moderate cost <strong>of</strong> bottled water (which is also the case for Mexico).Within Europe, Germany has the highest total consumption, with a growth <strong>of</strong> 32.3% and209