Bottled Water Consumption: The Case of Italy - Wbiaus.org
Bottled Water Consumption: The Case of Italy - Wbiaus.org
Bottled Water Consumption: The Case of Italy - Wbiaus.org

Create successful ePaper yourself
Turn your PDF publications into a flip-book with our unique Google optimized e-Paper software.
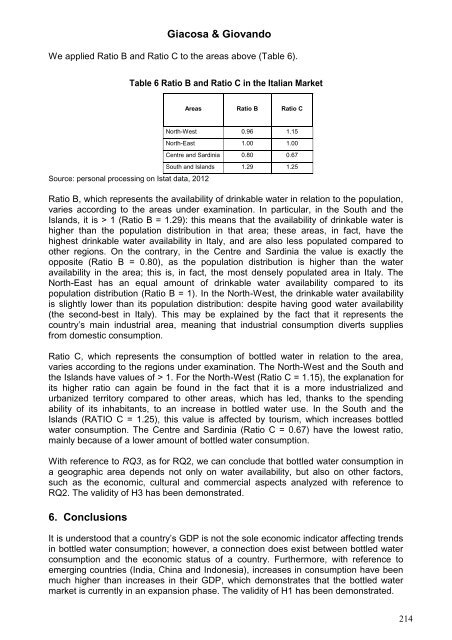
Giacosa & GiovandoWe applied Ratio B and Ratio C to the areas above (Table 6).Table 6 Ratio B and Ratio C in the Italian MarketAreas Ratio B Ratio CSource: personal processing on Istat data, 2012North-West 0.96 1.15North-East 1.00 1.00Centre and Sardinia 0.80 0.67South and Islands 1.29 1.25Ratio B, which represents the availability <strong>of</strong> drinkable water in relation to the population,varies according to the areas under examination. In particular, in the South and theIslands, it is > 1 (Ratio B = 1.29): this means that the availability <strong>of</strong> drinkable water ishigher than the population distribution in that area; these areas, in fact, have thehighest drinkable water availability in <strong>Italy</strong>, and are also less populated compared toother regions. On the contrary, in the Centre and Sardinia the value is exactly theopposite (Ratio B = 0.80), as the population distribution is higher than the wateravailability in the area; this is, in fact, the most densely populated area in <strong>Italy</strong>. <strong>The</strong>North-East has an equal amount <strong>of</strong> drinkable water availability compared to itspopulation distribution (Ratio B = 1). In the North-West, the drinkable water availabilityis slightly lower than its population distribution: despite having good water availability(the second-best in <strong>Italy</strong>). This may be explained by the fact that it represents thecountry’s main industrial area, meaning that industrial consumption diverts suppliesfrom domestic consumption.Ratio C, which represents the consumption <strong>of</strong> bottled water in relation to the area,varies according to the regions under examination. <strong>The</strong> North-West and the South andthe Islands have values <strong>of</strong> > 1. For the North-West (Ratio C = 1.15), the explanation forits higher ratio can again be found in the fact that it is a more industrialized andurbanized territory compared to other areas, which has led, thanks to the spendingability <strong>of</strong> its inhabitants, to an increase in bottled water use. In the South and theIslands (RATIO C = 1.25), this value is affected by tourism, which increases bottledwater consumption. <strong>The</strong> Centre and Sardinia (Ratio C = 0.67) have the lowest ratio,mainly because <strong>of</strong> a lower amount <strong>of</strong> bottled water consumption.With reference to RQ3, as for RQ2, we can conclude that bottled water consumption ina geographic area depends not only on water availability, but also on other factors,such as the economic, cultural and commercial aspects analyzed with reference toRQ2. <strong>The</strong> validity <strong>of</strong> H3 has been demonstrated.6. ConclusionsIt is understood that a country’s GDP is not the sole economic indicator affecting trendsin bottled water consumption; however, a connection does exist between bottled waterconsumption and the economic status <strong>of</strong> a country. Furthermore, with reference toemerging countries (India, China and Indonesia), increases in consumption have beenmuch higher than increases in their GDP, which demonstrates that the bottled watermarket is currently in an expansion phase. <strong>The</strong> validity <strong>of</strong> H1 has been demonstrated.214