Bottled Water Consumption: The Case of Italy - Wbiaus.org
Bottled Water Consumption: The Case of Italy - Wbiaus.org
Bottled Water Consumption: The Case of Italy - Wbiaus.org

You also want an ePaper? Increase the reach of your titles
YUMPU automatically turns print PDFs into web optimized ePapers that Google loves.
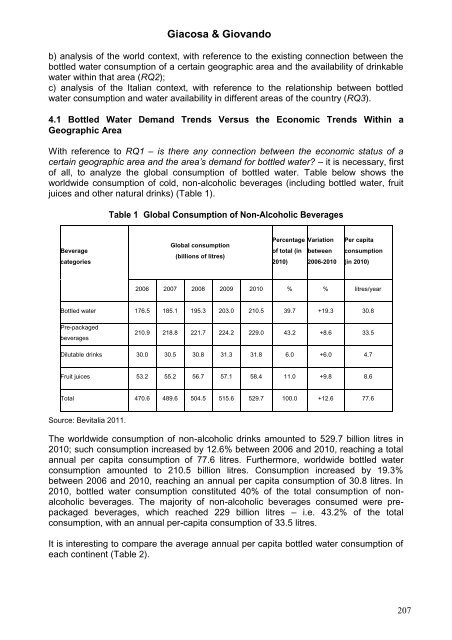
Giacosa & Giovandob) analysis <strong>of</strong> the world context, with reference to the existing connection between thebottled water consumption <strong>of</strong> a certain geographic area and the availability <strong>of</strong> drinkablewater within that area (RQ2);c) analysis <strong>of</strong> the Italian context, with reference to the relationship between bottledwater consumption and water availability in different areas <strong>of</strong> the country (RQ3).4.1 <strong>Bottled</strong> <strong>Water</strong> Demand Trends Versus the Economic Trends Within aGeographic AreaWith reference to RQ1 – is there any connection between the economic status <strong>of</strong> acertain geographic area and the area’s demand for bottled water? – it is necessary, first<strong>of</strong> all, to analyze the global consumption <strong>of</strong> bottled water. Table below shows theworldwide consumption <strong>of</strong> cold, non-alcoholic beverages (including bottled water, fruitjuices and other natural drinks) (Table 1).Table 1 Global <strong>Consumption</strong> <strong>of</strong> Non-Alcoholic BeveragesBeveragecategoriesGlobal consumption(billions <strong>of</strong> litres)Percentage Variation<strong>of</strong> total (in between2010) 2006-2010Per capitaconsumption(in 2010)2006 2007 2008 2009 2010 % % litres/year<strong>Bottled</strong> water 176.5 185.1 195.3 203.0 210.5 39.7 +19.3 30.8Pre-packagedbeverages210.9 218.8 221.7 224.2 229.0 43.2 +8.6 33.5Dilutable drinks 30.0 30.5 30.8 31.3 31.8 6.0 +6.0 4.7Fruit juices 53.2 55.2 56.7 57.1 58.4 11.0 +9.8 8.6Total 470.6 489.6 504.5 515.6 529.7 100.0 +12.6 77.6Source: Bevitalia 2011.<strong>The</strong> worldwide consumption <strong>of</strong> non-alcoholic drinks amounted to 529.7 billion litres in2010; such consumption increased by 12.6% between 2006 and 2010, reaching a totalannual per capita consumption <strong>of</strong> 77.6 litres. Furthermore, worldwide bottled waterconsumption amounted to 210.5 billion litres. <strong>Consumption</strong> increased by 19.3%between 2006 and 2010, reaching an annual per capita consumption <strong>of</strong> 30.8 litres. In2010, bottled water consumption constituted 40% <strong>of</strong> the total consumption <strong>of</strong> nonalcoholicbeverages. <strong>The</strong> majority <strong>of</strong> non-alcoholic beverages consumed were prepackagedbeverages, which reached 229 billion litres – i.e. 43.2% <strong>of</strong> the totalconsumption, with an annual per-capita consumption <strong>of</strong> 33.5 litres.It is interesting to compare the average annual per capita bottled water consumption <strong>of</strong>each continent (Table 2).207