Bottled Water Consumption: The Case of Italy - Wbiaus.org
Bottled Water Consumption: The Case of Italy - Wbiaus.org
Bottled Water Consumption: The Case of Italy - Wbiaus.org

You also want an ePaper? Increase the reach of your titles
YUMPU automatically turns print PDFs into web optimized ePapers that Google loves.
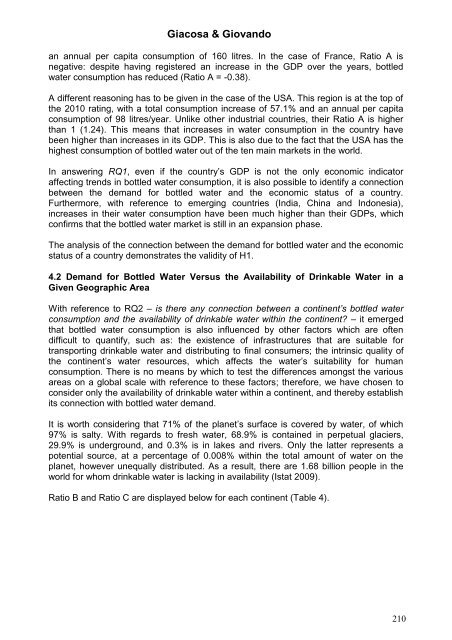
Giacosa & Giovandoan annual per capita consumption <strong>of</strong> 160 litres. In the case <strong>of</strong> France, Ratio A isnegative: despite having registered an increase in the GDP over the years, bottledwater consumption has reduced (Ratio A = -0.38).A different reasoning has to be given in the case <strong>of</strong> the USA. This region is at the top <strong>of</strong>the 2010 rating, with a total consumption increase <strong>of</strong> 57.1% and an annual per capitaconsumption <strong>of</strong> 98 litres/year. Unlike other industrial countries, their Ratio A is higherthan 1 (1.24). This means that increases in water consumption in the country havebeen higher than increases in its GDP. This is also due to the fact that the USA has thehighest consumption <strong>of</strong> bottled water out <strong>of</strong> the ten main markets in the world.In answering RQ1, even if the country’s GDP is not the only economic indicatoraffecting trends in bottled water consumption, it is also possible to identify a connectionbetween the demand for bottled water and the economic status <strong>of</strong> a country.Furthermore, with reference to emerging countries (India, China and Indonesia),increases in their water consumption have been much higher than their GDPs, whichconfirms that the bottled water market is still in an expansion phase.<strong>The</strong> analysis <strong>of</strong> the connection between the demand for bottled water and the economicstatus <strong>of</strong> a country demonstrates the validity <strong>of</strong> H1.4.2 Demand for <strong>Bottled</strong> <strong>Water</strong> Versus the Availability <strong>of</strong> Drinkable <strong>Water</strong> in aGiven Geographic AreaWith reference to RQ2 – is there any connection between a continent’s bottled waterconsumption and the availability <strong>of</strong> drinkable water within the continent? – it emergedthat bottled water consumption is also influenced by other factors which are <strong>of</strong>tendifficult to quantify, such as: the existence <strong>of</strong> infrastructures that are suitable fortransporting drinkable water and distributing to final consumers; the intrinsic quality <strong>of</strong>the continent’s water resources, which affects the water’s suitability for humanconsumption. <strong>The</strong>re is no means by which to test the differences amongst the variousareas on a global scale with reference to these factors; therefore, we have chosen toconsider only the availability <strong>of</strong> drinkable water within a continent, and thereby establishits connection with bottled water demand.It is worth considering that 71% <strong>of</strong> the planet’s surface is covered by water, <strong>of</strong> which97% is salty. With regards to fresh water, 68.9% is contained in perpetual glaciers,29.9% is underground, and 0.3% is in lakes and rivers. Only the latter represents apotential source, at a percentage <strong>of</strong> 0.008% within the total amount <strong>of</strong> water on theplanet, however unequally distributed. As a result, there are 1.68 billion people in theworld for whom drinkable water is lacking in availability (Istat 2009).Ratio B and Ratio C are displayed below for each continent (Table 4).210