Bottled Water Consumption: The Case of Italy - Wbiaus.org
Bottled Water Consumption: The Case of Italy - Wbiaus.org
Bottled Water Consumption: The Case of Italy - Wbiaus.org

Create successful ePaper yourself
Turn your PDF publications into a flip-book with our unique Google optimized e-Paper software.
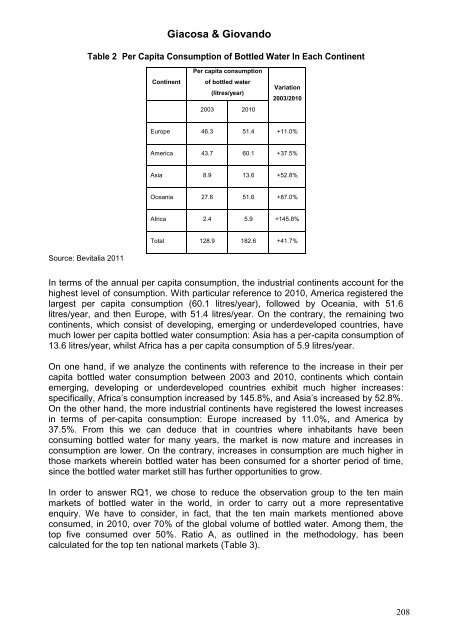
Giacosa & GiovandoTable 2 Per Capita <strong>Consumption</strong> <strong>of</strong> <strong>Bottled</strong> <strong>Water</strong> In Each ContinentContinentPer capita consumption<strong>of</strong> bottled water(litres/year)2003 2010Variation2003/2010Europe 46.3 51.4 +11.0%America 43.7 60.1 +37.5%Asia 8.9 13.6 +52.8%Oceania 27.6 51.6 +87.0%Africa 2.4 5.9 +145.8%Total 128.9 182.6 +41.7%Source: Bevitalia 2011In terms <strong>of</strong> the annual per capita consumption, the industrial continents account for thehighest level <strong>of</strong> consumption. With particular reference to 2010, America registered thelargest per capita consumption (60.1 litres/year), followed by Oceania, with 51.6litres/year, and then Europe, with 51.4 litres/year. On the contrary, the remaining twocontinents, which consist <strong>of</strong> developing, emerging or underdeveloped countries, havemuch lower per capita bottled water consumption: Asia has a per-capita consumption <strong>of</strong>13.6 litres/year, whilst Africa has a per capita consumption <strong>of</strong> 5.9 litres/year.On one hand, if we analyze the continents with reference to the increase in their percapita bottled water consumption between 2003 and 2010, continents which containemerging, developing or underdeveloped countries exhibit much higher increases:specifically, Africa’s consumption increased by 145.8%, and Asia’s increased by 52.8%.On the other hand, the more industrial continents have registered the lowest increasesin terms <strong>of</strong> per-capita consumption: Europe increased by 11.0%, and America by37.5%. From this we can deduce that in countries where inhabitants have beenconsuming bottled water for many years, the market is now mature and increases inconsumption are lower. On the contrary, increases in consumption are much higher inthose markets wherein bottled water has been consumed for a shorter period <strong>of</strong> time,since the bottled water market still has further opportunities to grow.In order to answer RQ1, we chose to reduce the observation group to the ten mainmarkets <strong>of</strong> bottled water in the world, in order to carry out a more representativeenquiry. We have to consider, in fact, that the ten main markets mentioned aboveconsumed, in 2010, over 70% <strong>of</strong> the global volume <strong>of</strong> bottled water. Among them, thetop five consumed over 50%. Ratio A, as outlined in the methodology, has beencalculated for the top ten national markets (Table 3).208