Bottled Water Consumption: The Case of Italy - Wbiaus.org
Bottled Water Consumption: The Case of Italy - Wbiaus.org
Bottled Water Consumption: The Case of Italy - Wbiaus.org

You also want an ePaper? Increase the reach of your titles
YUMPU automatically turns print PDFs into web optimized ePapers that Google loves.
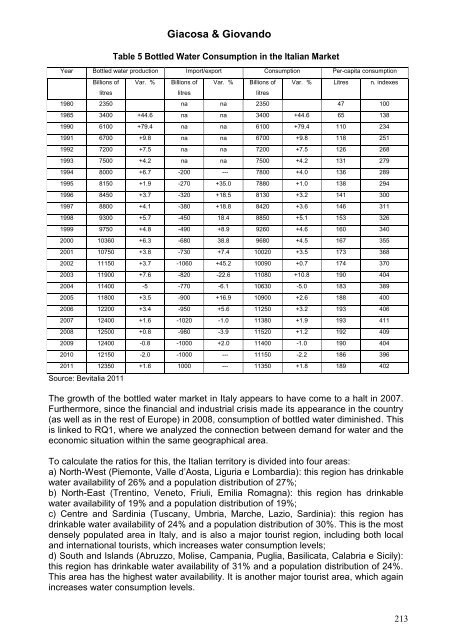
Giacosa & GiovandoTable 5 <strong>Bottled</strong> <strong>Water</strong> <strong>Consumption</strong> in the Italian MarketYear <strong>Bottled</strong> water production Import/export <strong>Consumption</strong> Per-capita consumptionBillions <strong>of</strong>litresVar. %Billions <strong>of</strong>litresVar. %Billions <strong>of</strong>litresVar. % Litres n. indexes1980 2350 na na 2350 47 1001985 3400 +44.6 na na 3400 +44.6 65 1381990 6100 +79.4 na na 6100 +79.4 110 2341991 6700 +9.8 na na 6700 +9.8 118 2511992 7200 +7.5 na na 7200 +7.5 126 2681993 7500 +4.2 na na 7500 +4.2 131 2791994 8000 +6.7 -200 --- 7800 +4.0 136 2891995 8150 +1.9 -270 +35.0 7880 +1.0 138 2941996 8450 +3.7 -320 +18.5 8130 +3.2 141 3001997 8800 +4.1 -380 +18.8 8420 +3.6 146 3111998 9300 +5.7 -450 18.4 8850 +5.1 153 3261999 9750 +4.8 -490 +8.9 9260 +4.6 160 3402000 10360 +6.3 -680 38.8 9680 +4.5 167 3552001 10750 +3.8 -730 +7.4 10020 +3.5 173 3682002 11150 +3.7 -1060 +45.2 10090 +0.7 174 3702003 11900 +7.6 -820 -22.6 11080 +10.8 190 4042004 11400 -5 -770 -6.1 10630 -5.0 183 3892005 11800 +3.5 -900 +16.9 10900 +2.6 188 4002006 12200 +3.4 -950 +5.6 11250 +3.2 193 4062007 12400 +1.6 -1020 -1.0 11380 +1.9 193 4112008 12500 +0.8 -980 -3.9 11520 +1.2 192 4092009 12400 -0.8 -1000 +2.0 11400 -1.0 190 4042010 12150 -2.0 -1000 --- 11150 -2.2 186 3962011 12350 +1.6 1000 --- 11350 +1.8 189 402Source: Bevitalia 2011<strong>The</strong> growth <strong>of</strong> the bottled water market in <strong>Italy</strong> appears to have come to a halt in 2007.Furthermore, since the financial and industrial crisis made its appearance in the country(as well as in the rest <strong>of</strong> Europe) in 2008, consumption <strong>of</strong> bottled water diminished. Thisis linked to RQ1, where we analyzed the connection between demand for water and theeconomic situation within the same geographical area.To calculate the ratios for this, the Italian territory is divided into four areas:a) North-West (Piemonte, Valle d’Aosta, Liguria e Lombardia): this region has drinkablewater availability <strong>of</strong> 26% and a population distribution <strong>of</strong> 27%;b) North-East (Trentino, Veneto, Friuli, Emilia Romagna): this region has drinkablewater availability <strong>of</strong> 19% and a population distribution <strong>of</strong> 19%;c) Centre and Sardinia (Tuscany, Umbria, Marche, Lazio, Sardinia): this region hasdrinkable water availability <strong>of</strong> 24% and a population distribution <strong>of</strong> 30%. This is the mostdensely populated area in <strong>Italy</strong>, and is also a major tourist region, including both localand international tourists, which increases water consumption levels;d) South and Islands (Abruzzo, Molise, Campania, Puglia, Basilicata, Calabria e Sicily):this region has drinkable water availability <strong>of</strong> 31% and a population distribution <strong>of</strong> 24%.This area has the highest water availability. It is another major tourist area, which againincreases water consumption levels.213