Bottled Water Consumption: The Case of Italy - Wbiaus.org
Bottled Water Consumption: The Case of Italy - Wbiaus.org
Bottled Water Consumption: The Case of Italy - Wbiaus.org

Create successful ePaper yourself
Turn your PDF publications into a flip-book with our unique Google optimized e-Paper software.
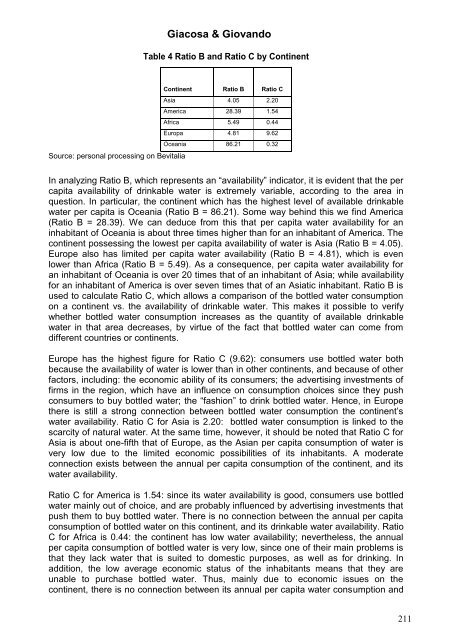
Giacosa & GiovandoTable 4 Ratio B and Ratio C by ContinentContinent Ratio B Ratio CAsia 4.05 2.20America 28.39 1.54Africa 5.49 0.44Europa 4.81 9.62Oceania 86.21 0.32Source: personal processing on BevitaliaIn analyzing Ratio B, which represents an “availability” indicator, it is evident that the percapita availability <strong>of</strong> drinkable water is extremely variable, according to the area inquestion. In particular, the continent which has the highest level <strong>of</strong> available drinkablewater per capita is Oceania (Ratio B = 86.21). Some way behind this we find America(Ratio B = 28.39). We can deduce from this that per capita water availability for aninhabitant <strong>of</strong> Oceania is about three times higher than for an inhabitant <strong>of</strong> America. <strong>The</strong>continent possessing the lowest per capita availability <strong>of</strong> water is Asia (Ratio B = 4.05).Europe also has limited per capita water availability (Ratio B = 4.81), which is evenlower than Africa (Ratio B = 5.49). As a consequence, per capita water availability foran inhabitant <strong>of</strong> Oceania is over 20 times that <strong>of</strong> an inhabitant <strong>of</strong> Asia; while availabilityfor an inhabitant <strong>of</strong> America is over seven times that <strong>of</strong> an Asiatic inhabitant. Ratio B isused to calculate Ratio C, which allows a comparison <strong>of</strong> the bottled water consumptionon a continent vs. the availability <strong>of</strong> drinkable water. This makes it possible to verifywhether bottled water consumption increases as the quantity <strong>of</strong> available drinkablewater in that area decreases, by virtue <strong>of</strong> the fact that bottled water can come fromdifferent countries or continents.Europe has the highest figure for Ratio C (9.62): consumers use bottled water bothbecause the availability <strong>of</strong> water is lower than in other continents, and because <strong>of</strong> otherfactors, including: the economic ability <strong>of</strong> its consumers; the advertising investments <strong>of</strong>firms in the region, which have an influence on consumption choices since they pushconsumers to buy bottled water; the “fashion” to drink bottled water. Hence, in Europethere is still a strong connection between bottled water consumption the continent’swater availability. Ratio C for Asia is 2.20: bottled water consumption is linked to thescarcity <strong>of</strong> natural water. At the same time, however, it should be noted that Ratio C forAsia is about one-fifth that <strong>of</strong> Europe, as the Asian per capita consumption <strong>of</strong> water isvery low due to the limited economic possibilities <strong>of</strong> its inhabitants. A moderateconnection exists between the annual per capita consumption <strong>of</strong> the continent, and itswater availability.Ratio C for America is 1.54: since its water availability is good, consumers use bottledwater mainly out <strong>of</strong> choice, and are probably influenced by advertising investments thatpush them to buy bottled water. <strong>The</strong>re is no connection between the annual per capitaconsumption <strong>of</strong> bottled water on this continent, and its drinkable water availability. RatioC for Africa is 0.44: the continent has low water availability; nevertheless, the annualper capita consumption <strong>of</strong> bottled water is very low, since one <strong>of</strong> their main problems isthat they lack water that is suited to domestic purposes, as well as for drinking. Inaddition, the low average economic status <strong>of</strong> the inhabitants means that they areunable to purchase bottled water. Thus, mainly due to economic issues on thecontinent, there is no connection between its annual per capita water consumption and211