<strong>WAUKESHA</strong> <strong>COUNTY</strong>, WISCONSINCOMBINING STATEMENT OF REVENUES, EXPENSES AND CHANGES INNET ASSETS - ALL NON-MAJOR ENTERPRISE FUNDSFor The Year Ended December 31, 2010OPERATING REVENUESCharges for servicesLease revenue 178,537MaterialsTotalRadio Golf Ice Recovery Non-MajorServices Course Arena Facility EnterpriseFund Fund Fund Fund Funds$ $ - $ - $ - $ 178,537County park fees - 2,932,592 1,052,591 - 3,985,183Other 446,154 - - 136,794 582,948Interdepartmental revenues 598,719 - - - 598,719Miscellaneous revenuesRecycling sales - - - 1,186,898 1,186,898Other - 2,928 - - 2,928Total operating revenues 1,223,410 2,935,520 1,052,591 1,323,692 6,535,213OPERATING EXPENSESSalaries 348,265 917,678 362,558 - 1,628,501Benefits 157,065 278,313 92,813 - 528,191Operating 171,220 761,781 329,079 126,201 1,388,281Purchased servicesContracted - 5,850 280 32,316 38,446Transportation - - - 54,967 54,967Payments to municipalities - - - 1,107,976 1,107,976Other 3,889 72,259 40,916 82,213 199,277Interdepartmental 112,344 919,450 73,106 210,693 1,315,593Depreciation 430,249 188,444 216,291 187,963 1,022,947Total operating expenses 1,223,032 3,143,775 1,115,043 1,802,329 7,284,179Operating income (loss) 378 (208,255) (62,452) (478,637) (748,966)NON-OPERATING REVENUES (EXPENSES)Intergovernmental contracts/grantsState aid - recycling - - - 1,273,410 1,273,410Investment earnings - 25,882 10,269 - 36,151Interest expense (18,834) - - - (18,834)Gain (loss) on disposal of capital assets - (666) - - (666)Total non-operating revenues (expenses) (18,834) 25,216 10,269 1,273,410 1,290,061Income (loss) before transfers (18,456) (183,039) (52,183) 794,773 541,095Transfers out - - - (395,300) (395,300)Increase (decrease) in net assets (18,456) (183,039) (52,183) 399,473 145,795Net assets - January 1 5,639,799 4,573,695 2,835,145 13,299,074 26,347,713Net assets - December 31 $ 5,621,343 $ 4,390,656 $ 2,782,962 $ 13,698,547 $ 26,493,508123
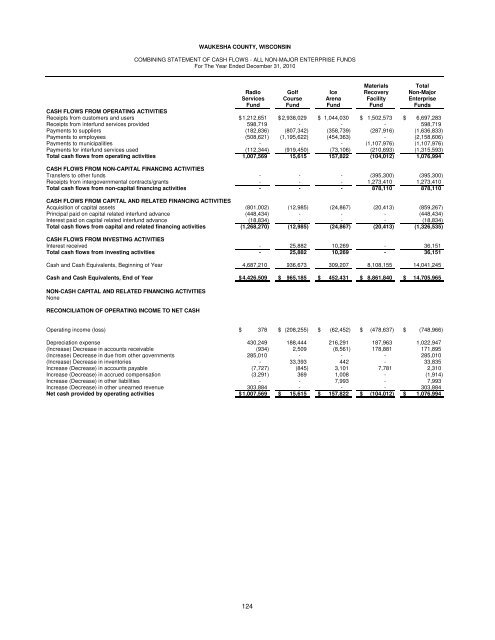
<strong>WAUKESHA</strong> <strong>COUNTY</strong>, WISCONSINCOMBINING STATEMENT OF CASH FLOWS - ALL NON-MAJOR ENTERPRISE FUNDSFor The Year Ended December 31, 2010Materials TotalRadio Golf Ice Recovery Non-MajorServices Course Arena Facility EnterpriseFund Fund Fund Fund FundsCASH FLOWS FROM OPERATING ACTIVITIESReceipts from customers and users $ 1,212,651 $ 2,938,029 $ 1,044,030 $ 1,502,573 $ 6,697,283Receipts from interfund services provided 598,719 - - - 598,719Payments to suppliers (182,836) (807,342) (358,739) (287,916) (1,636,833)Payments to employees (508,621) (1,195,622) (454,363) - (2,158,606)Payments to municipalities - - - (1,107,976) (1,107,976)Payments for interfund services used (112,344) (919,450) (73,106) (210,693) (1,315,593)Total cash flows from operating activities1,007,569 15,615 157,822 (104,012) 1,076,994CASH FLOWS FROM NON-CAPITAL FINANCING ACTIVITIESTransfers to other funds - - - (395,300) (395,300)Receipts from intergovernmental contracts/grants - - - 1,273,410 1,273,410Total cash flows from non-capital financing activities - - - 878,110 878,110CASH FLOWS FROM CAPITAL AND RELATED FINANCING ACTIVITIESAcquisition of capital assets (801,002) (12,985) (24,867) (20,413) (859,267)Principal paid on capital related interfund advance (448,434) - - - (448,434)Interest paid on capital related interfund advance (18,834) - - - (18,834)Total cash flows from capital and related financing activities (1,268,270) (12,985) (24,867) (20,413) (1,326,535)CASH FLOWS FROM INVESTING ACTIVITIESInterest received - 25,882 10,269 - 36,151Total cash flows from investing activities - 25,882 10,269 - 36,151Cash and Cash Equivalents, Beginning of Year 4,687,210 936,673 309,207 8,108,155 14,041,245Cash and Cash Equivalents, End of Year $ 4,426,509 $ 965,185 $ 452,431 $ 8,861,840 $ 14,705,965NON-CASH CAPITAL AND RELATED FINANCING ACTIVITIESNoneRECONCILIATION OF OPERATING INCOME TO NET CASHOperating income (loss) $ 378 $ (208,255) $ (62,452) $ (478,637) $ (748,966)Depreciation expense 430,249 188,444 216,291 187,963 1,022,947(Increase) Decrease in accounts receivable (934) 2,509 (8,561) 178,881 171,895(Increase) Decrease in due from other governments 285,010 - - - 285,010(Increase) Decrease in inventories - 33,393 442 - 33,835Increase (Decrease) in accounts payable (7,727) (845) 3,101 7,781 2,310Increase (Decrease) in accrued compensation (3,291) 369 1,008 - (1,914)Increase (Decrease) in other liabilities - - 7,993 - 7,993Increase (Decrease) in other unearned revenue 303,884 - - - 303,884Net cash provided by operating activities $ 1,007,569 $ 15,615 $ 157,822 $ (104,012) $ 1,076,994124
- Page 1 and 2:
WAUKESHA COUNTYCOMPREHENSIVE ANNUAL
- Page 3 and 4:
COMPREHENSIVE ANNUAL FINANCIAL REPO
- Page 5 and 6:
WAUKESHA COUNTY WISCONSINCOMPREHENS
- Page 7 and 8:
Daniel P. VrakasCounty ExecutiveJun
- Page 9 and 10:
WAUKESHA COUNTY, WISCONSINEqualized
- Page 11 and 12:
Residential property accounts for o
- Page 13 and 14:
The County’s tax levy rate, which
- Page 15:
udget controls are maintained at th
- Page 19 and 20:
WAUKESHA COUNTYDepartment HeadsAdmi
- Page 21:
JUDICIARY AND LAW ENFORCEMENT COMMI
- Page 24 and 25:
To the Honorable Board of County Su
- Page 27 and 28:
WAUKESHA COUNTY, WISCONSINMANAGEMEN
- Page 29 and 30:
WAUKESHA COUNTY, WISCONSINMANAGEMEN
- Page 31 and 32:
WAUKESHA COUNTY, WISCONSINMANAGEMEN
- Page 33 and 34:
WAUKESHA COUNTY, WISCONSINMANAGEMEN
- Page 35 and 36:
WAUKESHA COUNTY, WISCONSINMANAGEMEN
- Page 37 and 38:
WAUKESHA COUNTY, WISCONSINMANAGEMEN
- Page 39:
GOVERNMENT-WIDE STATEMENTS
- Page 42 and 43:
WAUKESHA COUNTY, WISCONSINSTATEMENT
- Page 45 and 46:
WAUKESHA COUNTY, WISCONSINBALANCE S
- Page 47 and 48:
WAUKESHA COUNTY, WISCONSINSTATEMENT
- Page 49:
MAJOR PROPRIETARY FUNDSAIRPORT OPER
- Page 52 and 53:
WAUKESHA COUNTY, WISCONSINSTATEMENT
- Page 54 and 55:
WAUKESHA COUNTY, WISCONSINSTATEMENT
- Page 57 and 58:
WAUKESHA COUNTY, WISCONSINSTATEMENT
- Page 59 and 60:
WAUKESHA COUNTY, WISCONSININDEX TO
- Page 61 and 62:
WAUKESHA COUNTY, WISCONSINNOTES TO
- Page 63 and 64:
WAUKESHA COUNTY, WISCONSINNOTES TO
- Page 65 and 66:
WAUKESHA COUNTY, WISCONSINNOTES TO
- Page 67 and 68:
WAUKESHA COUNTY, WISCONSINNOTES TO
- Page 69 and 70:
WAUKESHA COUNTY, WISCONSINNOTES TO
- Page 71 and 72:
WAUKESHA COUNTY, WISCONSINNOTES TO
- Page 73 and 74:
WAUKESHA COUNTY, WISCONSINNOTES TO
- Page 75 and 76:
WAUKESHA COUNTY, WISCONSINNOTES TO
- Page 77 and 78:
NOTE 4 - DEPOSITS AND INVESTMENTS (
- Page 79 and 80:
NOTE 4 - DEPOSITS AND INVESTMENTS (
- Page 81 and 82:
WAUKESHA COUNTY, WISCONSINNOTES TO
- Page 83 and 84:
WAUKESHA COUNTY, WISCONSINNOTES TO
- Page 85 and 86:
WAUKESHA COUNTY, WISCONSINNOTES TO
- Page 87 and 88:
WAUKESHA COUNTY, WISCONSINNOTES TO
- Page 89 and 90:
NOTE 11- LEASE DISCLOSURES (CONT’
- Page 91 and 92:
NOTE 13- COMPONENT UNIT (CONT’D)W
- Page 93 and 94:
NOTE 13- COMPONENT UNIT (CONT’D)W
- Page 95 and 96:
NOTE 13- COMPONENT UNIT (CONT’D)N
- Page 97 and 98:
NOTE 15- RISK MANAGEMENT/SELF INSUR
- Page 99 and 100:
WAUKESHA COUNTY, WISCONSINNOTES TO
- Page 101:
REQUIRED SUPPLEMENTARY INFORMATION
- Page 104 and 105:
WAUKESHA COUNTY, WISCONSINSCHEDULE
- Page 106 and 107:
WAUKESHA COUNTY, WISCONSINSCHEDULE
- Page 108 and 109:
WAUKESHA COUNTY, WISCONSINSCHEDULE
- Page 110 and 111: WAUKESHA COUNTY, WISCONSINNOTES TO
- Page 113 and 114: WAUKESHA COUNTY, WISCONSINCOMBINING
- Page 115: NON-MAJOR SPECIAL REVENUE FUNDSSpec
- Page 118 and 119: WAUKESHA COUNTY, WISCONSINCOMBINING
- Page 120 and 121: WAUKESHA COUNTY, WISCONSINCOMBINING
- Page 122 and 123: WAUKESHA COUNTY, WISCONSINSCHEDULE
- Page 124 and 125: WAUKESHA COUNTY, WISCONSINSCHEDULE
- Page 126 and 127: WAUKESHA COUNTY, WISCONSINSCHEDULE
- Page 128 and 129: WAUKESHA COUNTY, WISCONSINSCHEDULE
- Page 130 and 131: WAUKESHA COUNTY, WISCONSINSCHEDULE
- Page 132 and 133: WAUKESHA COUNTY, WISCONSINSCHEDULE
- Page 134 and 135: THIS PAGE LEFT BLANK
- Page 137 and 138: WAUKESHA COUNTY, WISCONSINSCHEDULE
- Page 139 and 140: NON-MAJOR CAPITAL PROJECTS FUNDSCap
- Page 141 and 142: THIS PAGE LEFT BLANK
- Page 143 and 144: WAUKESHA COUNTY, WISCONSINCOMBINING
- Page 145 and 146: WAUKESHA COUNTY, WISCONSINCOMBINING
- Page 147 and 148: WAUKESHA COUNTY, WISCONSINSCHEDULE
- Page 149 and 150: WAUKESHA COUNTY, WISCONSINSCHEDULE
- Page 151 and 152: WAUKESHA COUNTY, WISCONSINSCHEDULE
- Page 153 and 154: WAUKESHA COUNTY, WISCONSINSCHEDULE
- Page 155 and 156: WAUKESHA COUNTY, WISCONSINSCHEDULE
- Page 157: NON-MAJOR ENTERPRISE FUNDSEnterpris
- Page 162 and 163: THIS PAGE LEFT BLANK
- Page 165 and 166: THIS PAGE LEFT BLANK
- Page 167 and 168: WAUKESHA COUNTY, WISCONSINCOMBINING
- Page 169 and 170: WAUKESHA COUNTY, WISCONSINCOMBINING
- Page 171: NON-MAJOR FIDUCIARY FUNDSAGENCY FUN
- Page 174 and 175: WAUKESHA COUNTY, WISCONSINCOMBINING
- Page 176 and 177: WAUKESHA COUNTY, WISCONSINCOMBINING
- Page 178 and 179: WAUKESHA COUNTY, WISCONSINCOMBINING
- Page 181 and 182: THIS PAGE LEFT BLANK
- Page 183 and 184: WAUKESHA COUNTY, WISCONSINSCHEDULE
- Page 185 and 186: WAUKESHA COUNTY, WISCONSINSCHEDULE
- Page 187: CAPITAL ASSETS USED IN THE OPERATIO
- Page 190 and 191: WAUKESHA COUNTY, WISCONSINCAPITAL A
- Page 192 and 193: WAUKESHA COUNTY, WISCONSINACCUMULAT
- Page 195 and 196: THIS PAGE LEFT BLANK
- Page 197 and 198: WAUKESHA COUNTY, WISCONSINTABLE 1NE
- Page 199 and 200: WAUKESHA COUNTY, WISCONSINTABLE 2CH
- Page 201 and 202: WAUKESHA COUNTY, WISCONSINTABLE 2CH
- Page 203 and 204: WAUKESHA COUNTY, WISCONSINTABLE 3CH
- Page 205 and 206: WAUKESHA COUNTY, WISCONSINTABLE 4CH
- Page 207 and 208: WAUKESHA COUNTY, WISCONSINTABLE 6DI
- Page 209 and 210: WAUKESHA COUNTY, WISCONSINTABLE 8PR
- Page 211 and 212:
THIS PAGE LEFT BLANK
- Page 213 and 214:
WAUKESHA COUNTY, WISCONSINTABLE 10L
- Page 215 and 216:
WAUKESHA COUNTY, WISCONSINTABLE 11C
- Page 217 and 218:
WAUKESHA COUNTY, WISCONSINTABLE 13T
- Page 219 and 220:
WAUKESHA COUNTY, WISCONSINTABLE 14F
- Page 221 and 222:
WAUKESHA COUNTY, WISCONSINTABLE 15M
- Page 223 and 224:
WAUKESHA COUNTY, WISCONSINTABLE 16C