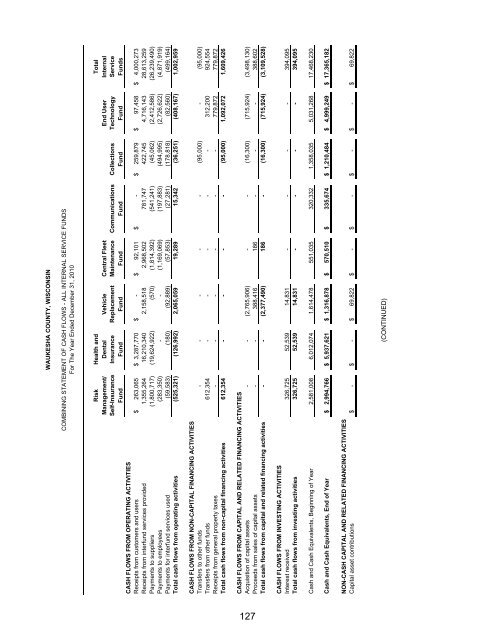
<strong>WAUKESHA</strong> <strong>COUNTY</strong>, WISCONSINCOMBINING STATEMENT OF CASH FLOWS - ALL INTERNAL SERVICE FUNDSFor The Year Ended December 31, 2010Risk Health and TotalManagement/ Dental Vehicle Central Fleet End User InternalSelf-Insurance Insurance Replacement Maintenance Communications Collections Technology ServiceFund Fund Fund Fund Fund Fund Fund FundsCASH FLOWS FROM OPERATING ACTIVITIESReceipts from customers and users $ 263,065 $ 3,287,770 $ - $ 92,101 $ - $ 259,879 $ 97,458 $ 4,000,273Receipts from interfund services provided 1,355,264 16,210,340 2,158,518 2,968,502 781,747 422,745 4,716,143 28,613,259Payments to suppliers (1,800,717) (19,624,922) (570) (1,814,392) (541,241) (45,062) (2,412,586) (26,239,490)Payments to employees (283,350) - - (1,169,069) (197,883) (494,995) (2,726,622) (4,871,919)Payments for interfund services used (59,583) (180) (92,889) (57,853) (27,281) (178,818) (82,560) (499,164)Total cash flows from operating activities (525,321) (126,992) 2,065,059 19,289 15,342 (36,251) (408,167) 1,002,959CASH FLOWS FROM NON-CAPITAL FINANCING ACTIVITIESTransfers to other funds - - - - - (95,000) - (95,000)Transfers from other funds 612,354 - - - - - 312,200 924,554Receipts from general property taxes - - - - - - 779,872 779,872Total cash flows from non-capital financing activities 612,354 - - - - (95,000) 1,092,072 1,609,426CASH FLOWS FROM CAPITAL AND RELATED FINANCING ACTIVITIESAcquisition of capital assets - - (2,765,906) - - (16,300) (715,924) (3,498,130)Proceeds from sales of capital assets - - 388,416 186 - - - 388,602Total cash flows from capital and related financing activities - - (2,377,490) 186 - (16,300) (715,924) (3,109,528)CASH FLOWS FROM INVESTING ACTIVITIESInterest received 326,725 52,539 14,831 - - - - 394,095Total cash flows from investing activities 326,725 52,539 14,831 - - - - 394,095Cash and Cash Equivalents, Beginning of Year 2,581,008 6,012,074 1,614,478 551,035 320,332 1,358,035 5,031,268 17,468,230Cash and Cash Equivalents, End of Year $ 2,994,766 $ 5,937,621 $ 1,316,878 $ 570,510 $ 335,674 $ 1,210,484 $ 4,999,249 $ 17,365,182NON-CASH CAPITAL AND RELATED FINANCING ACTIVITIESCapital asset contributions $ - $ - $ 69,822 $ - $ - $ - $ - $ 69,822(CONTINUED)127
<strong>WAUKESHA</strong> <strong>COUNTY</strong>, WISCONSINCOMBINING STATEMENT OF CASH FLOWS - ALL INTERNAL SERVICE FUNDSFor The Year Ended December 31, 2010RECONCILIATION OF OPERATING INCOME (LOSS) TO NET CASHPROVIDED FROM OPERATING ACTIVITIESRisk Health and TotalManagement/ Dental Vehicle Central Fleet End User InternalSelf-Insurance Insurance Replacement Maintenance Communications Collections Technology ServiceFund Fund Fund Fund Fund Fund Fund FundsOperating income (loss) $ (847,169) $ (317,530) $ (145,274) $ (161,931) $ 8,759 $ (105,923) $ (1,054,429) $ (2,623,497)Depreciation expense 212 - 2,210,333 134,820 9,087 4,045 566,010 2,924,507(Increase) Decrease in accounts receivable 11,900 (8,176) - - (26) (10,088) 2,453 (3,937)(Increase) Decrease in due from other governments 18,017 - - - (385) 1,334 (18) 18,948(Increase) Decrease in prepaid items - (90,982) - - - - (155,701) (246,683)(Increase) Decrease in inventories - - - (66,231) (609) - - (66,840)Increase (Decrease) in accounts payable 204,779 (1,305) - 108,622 (1,996) (2,103) 232,079 540,076Increase (Decrease) in accrued compensation 135 - - 4,009 512 1,310 1,439 7,405Increase (Decrease) in other liabilities - - - - - 75,174 - 75,174Increase (Decrease) in claims payable 86,805 291,001 - - - - - 377,806Net cash provided by operating activities $ (525,321) $ (126,992) $ 2,065,059 $ 19,289 $ 15,342 $ (36,251) $ (408,167) $ 1,002,959RECONCILIATION OF CASH AND CASH EQUIVALENTS TOTHE COMBINED STATEMENT OF NET ASSETSCash and investments - statement of net assets $ 2,494,766 $ 5,937,621 $ 1,316,878 $ 570,510 $ 335,674 $ 1,210,484 $ 4,999,249 $ 16,865,182Restricted cash and investments - statement of net assets 500,000 - - - - - - 500,000Cash and cash equivalents - end of year $ 2,994,766 $ 5,937,621 $ 1,316,878 $ 570,510 $ 335,674 $ 1,210,484 $ 4,999,249 $ 17,365,182(CONCLUDED)128
- Page 1 and 2:
WAUKESHA COUNTYCOMPREHENSIVE ANNUAL
- Page 3 and 4:
COMPREHENSIVE ANNUAL FINANCIAL REPO
- Page 5 and 6:
WAUKESHA COUNTY WISCONSINCOMPREHENS
- Page 7 and 8:
Daniel P. VrakasCounty ExecutiveJun
- Page 9 and 10:
WAUKESHA COUNTY, WISCONSINEqualized
- Page 11 and 12:
Residential property accounts for o
- Page 13 and 14:
The County’s tax levy rate, which
- Page 15:
udget controls are maintained at th
- Page 19 and 20:
WAUKESHA COUNTYDepartment HeadsAdmi
- Page 21:
JUDICIARY AND LAW ENFORCEMENT COMMI
- Page 24 and 25:
To the Honorable Board of County Su
- Page 27 and 28:
WAUKESHA COUNTY, WISCONSINMANAGEMEN
- Page 29 and 30:
WAUKESHA COUNTY, WISCONSINMANAGEMEN
- Page 31 and 32:
WAUKESHA COUNTY, WISCONSINMANAGEMEN
- Page 33 and 34:
WAUKESHA COUNTY, WISCONSINMANAGEMEN
- Page 35 and 36:
WAUKESHA COUNTY, WISCONSINMANAGEMEN
- Page 37 and 38:
WAUKESHA COUNTY, WISCONSINMANAGEMEN
- Page 39:
GOVERNMENT-WIDE STATEMENTS
- Page 42 and 43:
WAUKESHA COUNTY, WISCONSINSTATEMENT
- Page 45 and 46:
WAUKESHA COUNTY, WISCONSINBALANCE S
- Page 47 and 48:
WAUKESHA COUNTY, WISCONSINSTATEMENT
- Page 49:
MAJOR PROPRIETARY FUNDSAIRPORT OPER
- Page 52 and 53:
WAUKESHA COUNTY, WISCONSINSTATEMENT
- Page 54 and 55:
WAUKESHA COUNTY, WISCONSINSTATEMENT
- Page 57 and 58:
WAUKESHA COUNTY, WISCONSINSTATEMENT
- Page 59 and 60:
WAUKESHA COUNTY, WISCONSININDEX TO
- Page 61 and 62:
WAUKESHA COUNTY, WISCONSINNOTES TO
- Page 63 and 64:
WAUKESHA COUNTY, WISCONSINNOTES TO
- Page 65 and 66:
WAUKESHA COUNTY, WISCONSINNOTES TO
- Page 67 and 68:
WAUKESHA COUNTY, WISCONSINNOTES TO
- Page 69 and 70:
WAUKESHA COUNTY, WISCONSINNOTES TO
- Page 71 and 72:
WAUKESHA COUNTY, WISCONSINNOTES TO
- Page 73 and 74:
WAUKESHA COUNTY, WISCONSINNOTES TO
- Page 75 and 76:
WAUKESHA COUNTY, WISCONSINNOTES TO
- Page 77 and 78:
NOTE 4 - DEPOSITS AND INVESTMENTS (
- Page 79 and 80:
NOTE 4 - DEPOSITS AND INVESTMENTS (
- Page 81 and 82:
WAUKESHA COUNTY, WISCONSINNOTES TO
- Page 83 and 84:
WAUKESHA COUNTY, WISCONSINNOTES TO
- Page 85 and 86:
WAUKESHA COUNTY, WISCONSINNOTES TO
- Page 87 and 88:
WAUKESHA COUNTY, WISCONSINNOTES TO
- Page 89 and 90:
NOTE 11- LEASE DISCLOSURES (CONT’
- Page 91 and 92:
NOTE 13- COMPONENT UNIT (CONT’D)W
- Page 93 and 94:
NOTE 13- COMPONENT UNIT (CONT’D)W
- Page 95 and 96:
NOTE 13- COMPONENT UNIT (CONT’D)N
- Page 97 and 98:
NOTE 15- RISK MANAGEMENT/SELF INSUR
- Page 99 and 100:
WAUKESHA COUNTY, WISCONSINNOTES TO
- Page 101:
REQUIRED SUPPLEMENTARY INFORMATION
- Page 104 and 105:
WAUKESHA COUNTY, WISCONSINSCHEDULE
- Page 106 and 107:
WAUKESHA COUNTY, WISCONSINSCHEDULE
- Page 108 and 109:
WAUKESHA COUNTY, WISCONSINSCHEDULE
- Page 110 and 111:
WAUKESHA COUNTY, WISCONSINNOTES TO
- Page 113 and 114:
WAUKESHA COUNTY, WISCONSINCOMBINING
- Page 115:
NON-MAJOR SPECIAL REVENUE FUNDSSpec
- Page 118 and 119: WAUKESHA COUNTY, WISCONSINCOMBINING
- Page 120 and 121: WAUKESHA COUNTY, WISCONSINCOMBINING
- Page 122 and 123: WAUKESHA COUNTY, WISCONSINSCHEDULE
- Page 124 and 125: WAUKESHA COUNTY, WISCONSINSCHEDULE
- Page 126 and 127: WAUKESHA COUNTY, WISCONSINSCHEDULE
- Page 128 and 129: WAUKESHA COUNTY, WISCONSINSCHEDULE
- Page 130 and 131: WAUKESHA COUNTY, WISCONSINSCHEDULE
- Page 132 and 133: WAUKESHA COUNTY, WISCONSINSCHEDULE
- Page 134 and 135: THIS PAGE LEFT BLANK
- Page 137 and 138: WAUKESHA COUNTY, WISCONSINSCHEDULE
- Page 139 and 140: NON-MAJOR CAPITAL PROJECTS FUNDSCap
- Page 141 and 142: THIS PAGE LEFT BLANK
- Page 143 and 144: WAUKESHA COUNTY, WISCONSINCOMBINING
- Page 145 and 146: WAUKESHA COUNTY, WISCONSINCOMBINING
- Page 147 and 148: WAUKESHA COUNTY, WISCONSINSCHEDULE
- Page 149 and 150: WAUKESHA COUNTY, WISCONSINSCHEDULE
- Page 151 and 152: WAUKESHA COUNTY, WISCONSINSCHEDULE
- Page 153 and 154: WAUKESHA COUNTY, WISCONSINSCHEDULE
- Page 155 and 156: WAUKESHA COUNTY, WISCONSINSCHEDULE
- Page 157: NON-MAJOR ENTERPRISE FUNDSEnterpris
- Page 160 and 161: WAUKESHA COUNTY, WISCONSINCOMBINING
- Page 162 and 163: THIS PAGE LEFT BLANK
- Page 165 and 166: THIS PAGE LEFT BLANK
- Page 167: WAUKESHA COUNTY, WISCONSINCOMBINING
- Page 171: NON-MAJOR FIDUCIARY FUNDSAGENCY FUN
- Page 174 and 175: WAUKESHA COUNTY, WISCONSINCOMBINING
- Page 176 and 177: WAUKESHA COUNTY, WISCONSINCOMBINING
- Page 178 and 179: WAUKESHA COUNTY, WISCONSINCOMBINING
- Page 181 and 182: THIS PAGE LEFT BLANK
- Page 183 and 184: WAUKESHA COUNTY, WISCONSINSCHEDULE
- Page 185 and 186: WAUKESHA COUNTY, WISCONSINSCHEDULE
- Page 187: CAPITAL ASSETS USED IN THE OPERATIO
- Page 190 and 191: WAUKESHA COUNTY, WISCONSINCAPITAL A
- Page 192 and 193: WAUKESHA COUNTY, WISCONSINACCUMULAT
- Page 195 and 196: THIS PAGE LEFT BLANK
- Page 197 and 198: WAUKESHA COUNTY, WISCONSINTABLE 1NE
- Page 199 and 200: WAUKESHA COUNTY, WISCONSINTABLE 2CH
- Page 201 and 202: WAUKESHA COUNTY, WISCONSINTABLE 2CH
- Page 203 and 204: WAUKESHA COUNTY, WISCONSINTABLE 3CH
- Page 205 and 206: WAUKESHA COUNTY, WISCONSINTABLE 4CH
- Page 207 and 208: WAUKESHA COUNTY, WISCONSINTABLE 6DI
- Page 209 and 210: WAUKESHA COUNTY, WISCONSINTABLE 8PR
- Page 211 and 212: THIS PAGE LEFT BLANK
- Page 213 and 214: WAUKESHA COUNTY, WISCONSINTABLE 10L
- Page 215 and 216: WAUKESHA COUNTY, WISCONSINTABLE 11C
- Page 217 and 218: WAUKESHA COUNTY, WISCONSINTABLE 13T
- Page 219 and 220:
WAUKESHA COUNTY, WISCONSINTABLE 14F
- Page 221 and 222:
WAUKESHA COUNTY, WISCONSINTABLE 15M
- Page 223 and 224:
WAUKESHA COUNTY, WISCONSINTABLE 16C