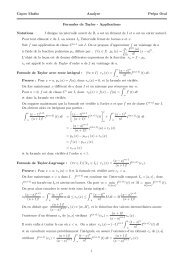
P. Béqu<strong>in</strong>, V. TournatRef. [22] forasta<strong>in</strong>lesssteelAISI420.Thus,an<strong>in</strong>crease<strong>in</strong> temperature when large currents pass through the contactregion between beads leads to an <strong>in</strong>crease <strong>in</strong> the electricalresistivity ρ <strong>and</strong> to a decrease <strong>in</strong> the thermal conductivityλ with<strong>in</strong> the contact<strong>in</strong>g material. Consequently a rise<strong>in</strong> temperature <strong>in</strong>creases resistivity—<strong>and</strong> <strong>Joule</strong> <strong>effect</strong>—<strong>and</strong>decreases thermal conductivity—which reduces the ability<strong>of</strong> the material to dissipate heat by thermal <strong>conduction</strong>. Inthe contact region between beads it is sufficient to cause asignificant heat accumulation. Moreover, it can be observedthat the saturation voltage U MAX <strong>in</strong>creases with the maximumcurrent I MAX .Consequently,thetemperatureatthecontact surface <strong>in</strong>creases <strong>and</strong> tends gradually towards themelt<strong>in</strong>g temperature <strong>of</strong> the contact<strong>in</strong>g material. A s<strong>of</strong>ten<strong>in</strong>g<strong>of</strong> the asperities is expected [13], <strong>and</strong> can lead to alocal micro-s<strong>in</strong>ter<strong>in</strong>g. As a result, the electrical resistivityis found to decrease with current I MAX (α decreases) <strong>and</strong>the thermal conductivity <strong>in</strong>creases with current I MAX (|β|decreases).For a cycle <strong>of</strong> electric current, coefficients α ↑ (<strong>in</strong>creas<strong>in</strong>gcurrent) <strong>and</strong> α ↓ (decreas<strong>in</strong>g current) present roughly equalvalues; <strong>in</strong> contrast coefficients β ↑ <strong>and</strong> β ↓ <strong>of</strong> thermal conductivityhave different values (|β ↓ | > |β ↑ |)thatmeasurementuncerta<strong>in</strong>ty cannot expla<strong>in</strong> al<strong>one</strong>. In model Eq. 6, thedependencies <strong>of</strong> electrical resistivity <strong>and</strong> thermal conductivityon temperature are considered l<strong>in</strong>ear (Eq. 5) overthewhole range <strong>of</strong> temperature (293–1800 K). On the basis <strong>of</strong>the presented results, <strong>one</strong> improvement could be to seek moreelaborated relations for ρ(T ) <strong>and</strong> λ(T ). Thedependenciescan be expressed as a power series <strong>of</strong> temperature T withmore terms than used <strong>in</strong> models [12,27]. Furthermore, it is<strong>in</strong>terest<strong>in</strong>g to note that a positive value <strong>of</strong> β ↑ for the <strong>in</strong>creas<strong>in</strong>gcurrents is deduced from Fig. 6. A thorough analysis <strong>of</strong>the experimental curve shows a po<strong>in</strong>t <strong>of</strong> <strong>in</strong>flection close toI = 0.44 A. This change <strong>of</strong> behavior could be ascribed toan <strong>in</strong>itial s<strong>of</strong>ten<strong>in</strong>g <strong>of</strong> the contact surface when the currentgrows, <strong>and</strong> could partly expla<strong>in</strong> the difference with the values<strong>in</strong> Table 3. The role <strong>of</strong> the latent heat <strong>in</strong> the possiblemicro-melt<strong>in</strong>g <strong>of</strong> the asperities is a highly complex phenomenonto model at this level <strong>of</strong> underst<strong>and</strong><strong>in</strong>g. It has notbeen taken <strong>in</strong>to account <strong>in</strong> the presented models: all the estimatedtemperatures rema<strong>in</strong> significantly lower than the melt<strong>in</strong>gpo<strong>in</strong>t. Only s<strong>of</strong>ten<strong>in</strong>g <strong>of</strong> the contacts <strong>and</strong> micro-s<strong>in</strong>ter<strong>in</strong>ghave been <strong>in</strong>voked here to <strong>in</strong>terpret the results. The study<strong>of</strong> the micro-structural changes <strong>of</strong> the contact areas by othermeans could be pr<strong>of</strong>itable to guide the future improvements<strong>of</strong> the models.In conclusion, these measurements show the diversity <strong>of</strong>electrical <strong>and</strong> thermal phenomena with<strong>in</strong> the cha<strong>in</strong>s <strong>of</strong> beads.The simplified models based on the Wiedemann–Franz’slaw fail to describe the electro-thermo-mechanical phenomena<strong>in</strong> a cha<strong>in</strong> <strong>of</strong> beads carry<strong>in</strong>g currents under a small appliedcompression force ∼1 N.5Electromagnetic<strong>effect</strong>sonacha<strong>in</strong><strong>of</strong>beadsThe l<strong>in</strong>ear <strong>and</strong> nonl<strong>in</strong>ear acoustic properties <strong>of</strong> granular materialsare strongly sensitive to the mechanical properties at thelevel <strong>of</strong> the contacts between beads [4]. For such studies, itcould be extremely convenient to be able to modify contactmechanical properties without any modification <strong>of</strong> the geometry<strong>of</strong> the medium. A controlled electromagnetic wave hasthe ability to produce these mechanical transformations withoutaffect<strong>in</strong>g the rema<strong>in</strong>der <strong>of</strong> the granular structure. In thiscontext, <strong>and</strong> as a complement to the previous part, this sectionreports an analysis <strong>of</strong> the electrical <strong>and</strong> thermal behaviors <strong>of</strong>acha<strong>in</strong><strong>of</strong>beadssubjectedtoastrongelectromagneticpulsecreated by a spark.This study can be viewed as a cont<strong>in</strong>uation <strong>of</strong> the work<strong>of</strong> Dorbolo et al. [21] whichwasdeal<strong>in</strong>gwiththe<strong>in</strong>fluence<strong>of</strong> an electromagnetic wave on the electrical resistance <strong>of</strong>the contacts between two beads. In [21], the electromagneticperturbation is found to affect preferentially the contacts hav<strong>in</strong>ga resistance higher than a threshold value which dependsma<strong>in</strong>ly on both the mechanical characteristics <strong>of</strong> the cha<strong>in</strong> <strong>of</strong>beads <strong>and</strong> <strong>of</strong> the distance between the latter <strong>and</strong> the spark (theelectromagnetic source). Here, we carry out measurementswith a near field electromagnetic excitation. They confirmpartly <strong>and</strong> extend the observations <strong>of</strong> Ref. [21] made<strong>in</strong>thefar field.5.1 Experimental set-upThe experimental set-up is presented <strong>in</strong> Fig. 9. Theelectromagneticwave is produced by a discharge across a spark gapas <strong>in</strong> Refs. [17,28].Experiments were performed us<strong>in</strong>g a “three-electrode system”<strong>in</strong> which the storage capacitor is kept charged at a voltage(from 0 to 20 kV) lower than the breakdown voltage <strong>of</strong>the gap <strong>in</strong> air at atmospheric conditions. A third electrodeis placed between the ma<strong>in</strong> electrodes to provide an <strong>in</strong>itialionization <strong>of</strong> the air necessary to cause the spark breakdownmechanism.5.2 ResultsFigure 10 shows the voltage–current characteristics for acycle <strong>of</strong> current (0–1 A). Dur<strong>in</strong>g this cycle, 5 sparks are created(distance between the cha<strong>in</strong> <strong>of</strong> beads <strong>and</strong> the electrodesr ≃ 120 mm) caus<strong>in</strong>g a voltage drop between the electrodes<strong>of</strong> the cha<strong>in</strong> <strong>of</strong> beads. These voltage drops can be connectedto strong variations <strong>of</strong> the contact impedances. It is observedthat for <strong>in</strong>creas<strong>in</strong>g dc currents I ,theelectricbehavior<strong>of</strong>thecha<strong>in</strong> <strong>of</strong> beads is less <strong>and</strong> less disturbed by the electromagneticpulses.The electromagnetic radiation created by these sparks<strong>in</strong>duces an electric current I sp <strong>in</strong> the cha<strong>in</strong> <strong>of</strong> beads which is123
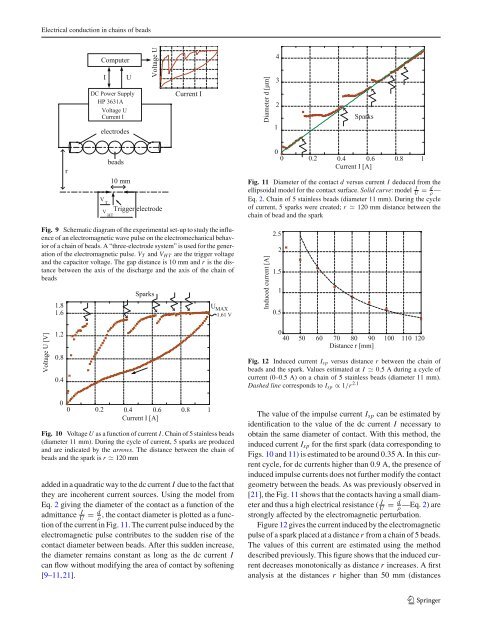
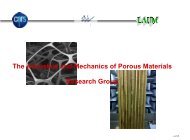
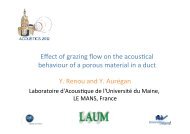
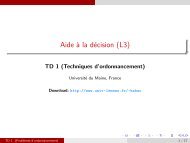
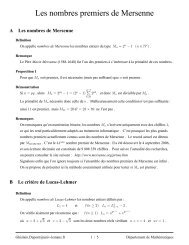
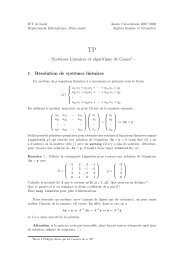
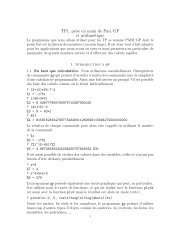
<strong>Electrical</strong> <strong>conduction</strong> <strong>in</strong> cha<strong>in</strong>s <strong>of</strong> beadsFig. 11 Diameter <strong>of</strong> the contact d versus current I deduced from theellipsoidal model for the contact surface. Solid curve: model I U = d ρ —Eq. 2. Cha<strong>in</strong> <strong>of</strong> 5 sta<strong>in</strong>less beads (diameter 11 mm). Dur<strong>in</strong>g the cycle<strong>of</strong> current, 5 sparks were created; r ≃ 120 mm distance between thecha<strong>in</strong> <strong>of</strong> bead <strong>and</strong> the sparkFig. 9 Schematic diagram <strong>of</strong> the experimental set-up to study the <strong>in</strong>fluence<strong>of</strong> an electromagnetic wave pulse on the electromechanical behavior<strong>of</strong> a cha<strong>in</strong> <strong>of</strong> beads. A “three-electrode system” is used for the generation<strong>of</strong> the electromagnetic pulse. V T <strong>and</strong> V HT are the trigger voltage<strong>and</strong> the capacitor voltage. The gap distance is 10 mm <strong>and</strong> r is the distancebetween the axis <strong>of</strong> the discharge <strong>and</strong> the axis <strong>of</strong> the cha<strong>in</strong> <strong>of</strong>beadsFig. 12 Induced current I sp versus distance r between the cha<strong>in</strong> <strong>of</strong>beads <strong>and</strong> the spark. Values estimated at I ≃ 0.5 Adur<strong>in</strong>gacycle<strong>of</strong>current (0–0.5 A) on a cha<strong>in</strong> <strong>of</strong> 5 sta<strong>in</strong>less beads (diameter 11 mm).Dashed l<strong>in</strong>e corresponds to I sp ∝ 1/r 2.1Fig. 10 Voltage U as a function <strong>of</strong> current I . Cha<strong>in</strong> <strong>of</strong> 5 sta<strong>in</strong>less beads(diameter 11 mm). Dur<strong>in</strong>g the cycle <strong>of</strong> current, 5 sparks are produced<strong>and</strong> are <strong>in</strong>dicated by the arrows. The distance between the cha<strong>in</strong> <strong>of</strong>beads <strong>and</strong> the spark is r ≃ 120 mmadded <strong>in</strong> a quadratic way to the dc current I due to the fact thatthey are <strong>in</strong>coherent current sources. Us<strong>in</strong>g the model fromEq. 2 giv<strong>in</strong>g the diameter <strong>of</strong> the contact as a function <strong>of</strong> theadmittance I U = d ρ ,thecontactdiameterisplottedasafunction<strong>of</strong> the current <strong>in</strong> Fig. 11.Thecurrentpulse<strong>in</strong>ducedbytheelectromagnetic pulse contributes to the sudden rise <strong>of</strong> thecontact diameter between beads. After this sudden <strong>in</strong>crease,the diameter rema<strong>in</strong>s constant as long as the dc current Ican flow without modify<strong>in</strong>g the area <strong>of</strong> contact by s<strong>of</strong>ten<strong>in</strong>g[9–11,21].The value <strong>of</strong> the impulse current I sp can be estimated byidentification to the value <strong>of</strong> the dc current I necessary toobta<strong>in</strong> the same diameter <strong>of</strong> contact. With this method, the<strong>in</strong>duced current I sp for the first spark (data correspond<strong>in</strong>g toFigs. 10 <strong>and</strong> 11)isestimatedtobearound0.35 A. In this currentcycle, for dc currents higher than 0.9 A, the presence <strong>of</strong><strong>in</strong>duced impulse currents does not further modify the contactgeometry between the beads. As was previously observed <strong>in</strong>[21], the Fig. 11 shows that the contacts hav<strong>in</strong>g a small diameter<strong>and</strong> thus a high electrical resistance (U I = ρ d —Eq. 2)arestrongly affected by the electromagnetic perturbation.Figure 12 gives the current <strong>in</strong>duced by the electromagneticpulse <strong>of</strong> a spark placed at a distance r from a cha<strong>in</strong> <strong>of</strong> 5 beads.The values <strong>of</strong> this current are estimated us<strong>in</strong>g the methoddescribed previously. This figure shows that the <strong>in</strong>duced currentdecreases monotonically as distance r <strong>in</strong>creases. A firstanalysis at the distances r higher than 50 mm (distances123