A fair chance - United Nations Girls' Education Initiative
A fair chance - United Nations Girls' Education Initiative
A fair chance - United Nations Girls' Education Initiative

You also want an ePaper? Increase the reach of your titles
YUMPU automatically turns print PDFs into web optimized ePapers that Google loves.
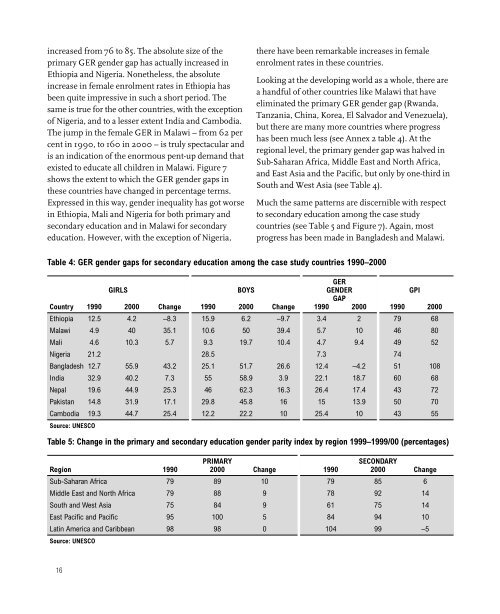
increased from 76 to 85. The absolute size of theprimary GER gender gap has actually increased inEthiopia and Nigeria. Nonetheless, the absoluteincrease in female enrolment rates in Ethiopia hasbeen quite impressive in such a short period. Thesame is true for the other countries, with the exceptionof Nigeria, and to a lesser extent India and Cambodia.The jump in the female GER in Malawi – from 62 percent in 1990, to 160 in 2000 – is truly spectacular andis an indication of the enormous pent-up demand thatexisted to educate all children in Malawi. Figure 7shows the extent to which the GER gender gaps inthese countries have changed in percentage terms.Expressed in this way, gender inequality has got worsein Ethiopia, Mali and Nigeria for both primary andsecondary education and in Malawi for secondaryeducation. However, with the exception of Nigeria,there have been remarkable increases in femaleenrolment rates in these countries.Looking at the developing world as a whole, there area handful of other countries like Malawi that haveeliminated the primary GER gender gap (Rwanda,Tanzania, China, Korea, El Salvador and Venezuela),but there are many more countries where progresshas been much less (see Annex 2 table 4). At theregional level, the primary gender gap was halved inSub-Saharan Africa, Middle East and North Africa,and East Asia and the Pacific, but only by one-third inSouth and West Asia (see Table 4).Much the same patterns are discernible with respectto secondary education among the case studycountries (see Table 5 and Figure 7). Again, mostprogress has been made in Bangladesh and Malawi.Table 4: GER gender gaps for secondary education among the case study countries 1990–2000GERGIRLS BOYS GENDER GPIGAPCountry 1990 2000 Change 1990 2000 Change 1990 2000 1990 2000Ethiopia 12.5 4.2 –8.3 15.9 6.2 –9.7 3.4 2 79 68Malawi 4.9 40 35.1 10.6 50 39.4 5.7 10 46 80Mali 4.6 10.3 5.7 9.3 19.7 10.4 4.7 9.4 49 52Nigeria 21.2 28.5 7.3 74Bangladesh 12.7 55.9 43.2 25.1 51.7 26.6 12.4 –4.2 51 108India 32.9 40.2 7.3 55 58.9 3.9 22.1 18.7 60 68Nepal 19.6 44.9 25.3 46 62.3 16.3 26.4 17.4 43 72Pakistan 14.8 31.9 17.1 29.8 45.8 16 15 13.9 50 70Cambodia 19.3 44.7 25.4 12.2 22.2 10 25.4 10 43 55Source: UNESCOTable 5: Change in the primary and secondary education gender parity index by region 1999–1999/00 (percentages)PRIMARYSECONDARYRegion 1990 2000 Change 1990 2000 ChangeSub-Saharan Africa 79 89 10 79 85 6Middle East and North Africa 79 88 9 78 92 14South and West Asia 75 84 9 61 75 14East Pacific and Pacific 95 100 5 84 94 10Latin America and Caribbean 98 98 0 104 99 –5Source: UNESCO16