A fair chance - United Nations Girls' Education Initiative
A fair chance - United Nations Girls' Education Initiative
A fair chance - United Nations Girls' Education Initiative

You also want an ePaper? Increase the reach of your titles
YUMPU automatically turns print PDFs into web optimized ePapers that Google loves.
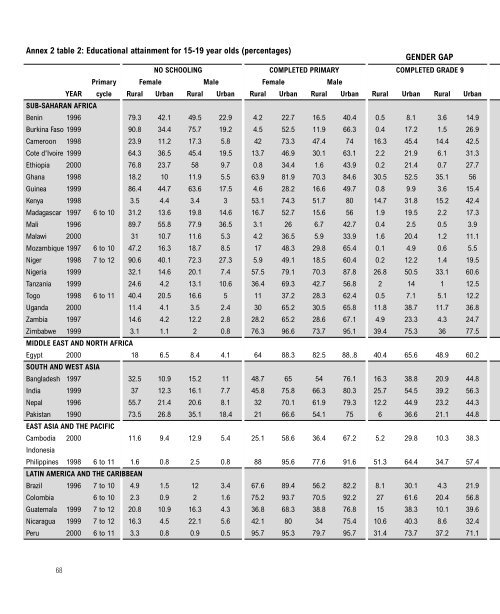
Annex 2 table 2: <strong>Education</strong>al attainment for 15-19 year olds (percentages)GENDER GAPNO SCHOOLING COMPLETED PRIMARY COMPLETED GRADE 9Primary Female Male Female MaleYEAR cycle Rural Urban Rural Urban Rural Urban Rural Urban Rural Urban Rural UrbanSUB-SAHARAN AFRICABenin 1996 79.3 42.1 49.5 22.9 4.2 22.7 16.5 40.4 0.5 8.1 3.6 14.9Burkina Faso 1999 90.8 34.4 75.7 19.2 4.5 52.5 11.9 66.3 0.4 17.2 1.5 26.9Cameroon 1998 23.9 11.2 17.3 5.8 42 73.3 47.4 74 16.3 45.4 14.4 42.5Cote d'Ivoire 1999 64.3 36.5 45.4 19.5 13.7 46.9 30.1 63.1 2.2 21.9 6.1 31.3Ethiopia 2000 76.8 23.7 58 9.7 0.8 34.4 1.6 43.9 0.2 21.4 0.7 27.7Ghana 1998 18.2 10 11.9 5.5 63.9 81.9 70.3 84.6 30.5 52.5 35.1 56Guinea 1999 86.4 44.7 63.6 17.5 4.6 28.2 16.6 49.7 0.8 9.9 3.6 15.4Kenya 1998 3.5 4.4 3.4 3 53.1 74.3 51.7 80 14.7 31.8 15.2 42.4Madagascar 1997 6 to 10 31.2 13.6 19.8 14.6 16.7 52.7 15.6 56 1.9 19.5 2.2 17.3Mali 1996 89.7 55.8 77.9 36.5 3.1 26 6.7 42.7 0.4 2.5 0.5 3.9Malawi 2000 31 10.7 11.6 5.3 4.2 36.5 5.9 33.9 1.6 20.4 1.2 11.1Mozambique 1997 6 to 10 47.2 16.3 18.7 8.5 17 48.3 29.8 65.4 0.1 4.9 0.6 5.5Niger 1998 7 to 12 90.6 40.1 72.3 27.3 5.9 49.1 18.5 60.4 0.2 12.2 1.4 19.5Nigeria 1999 32.1 14.6 20.1 7.4 57.5 79.1 70.3 87.8 26.8 50.5 33.1 60.6Tanzania 1999 24.6 4.2 13.1 10.6 36.4 69.3 42.7 56.8 2 14 1 12.5Togo 1998 6 to 11 40.4 20.5 16.6 5 11 37.2 28.3 62.4 0.5 7.1 5.1 12.2Uganda 2000 11.4 4.1 3.5 2.4 30 65.2 30.5 65.8 11.8 38.7 11.7 36.8Zambia 1997 14.6 4.2 12.2 2.8 28.2 65.2 28.6 67.1 4.9 23.3 4.3 24.7Zimbabwe 1999 3.1 1.1 2 0.8 76.3 96.6 73.7 95.1 39.4 75.3 36 77.5MIDDLE EAST AND NORTH AFRICAEgypt 2000 18 6.5 8.4 4.1 64 88.3 82.5 88..8 40.4 65.6 48.9 60.2SOUTH AND WEST ASIABangladesh 1997 32.5 10.9 15.2 11 48.7 65 54 76.1 16.3 38.8 20.9 44.8India 1999 37 12.3 16.1 7.7 45.8 75.8 66.3 80.3 25.7 54.5 39.2 56.3Nepal 1996 55.7 21.4 20.6 8.1 32 70.1 61.9 79.3 12.2 44.9 23.2 44.3Pakistan 1990 73.5 26.8 35.1 18.4 21 66.6 54.1 75 6 36.6 21.1 44.8EAST ASIA AND THE PACIFICCambodia 2000 11.6 9.4 12.9 5.4 25.1 58.6 36.4 67.2 5.2 29.8 10.3 38.3IndonesiaPhilippines 1998 6 to 11 1.6 0.8 2.5 0.8 88 95.6 77.6 91.6 51.3 64.4 34.7 57.4LATIN AMERICA AND THE CARIBBEANBrazil 1996 7 to 10 4.9 1.5 12 3.4 67.6 89.4 56.2 82.2 8.1 30.1 4.3 21.9Colombia 6 to 10 2.3 0.9 2 1.6 75.2 93.7 70.5 92.2 27 61.6 20.4 56.8Guatemala 1999 7 to 12 20.8 10.9 16.3 4.3 36.8 68.3 38.8 76.8 15 38.3 10.1 39.6Nicaragua 1999 7 to 12 16.3 4.5 22.1 5.6 42.1 80 34 75.4 10.6 40.3 8.6 32.4Peru 2000 6 to 11 3.3 0.8 0.9 0.5 95.7 95.3 79.7 95.7 31.4 73.7 37.2 71.168