- Page 1 and 2:
8NAWCNATIONAL ASSOCIATION OF WATER
- Page 3:
MNAWCNATIONAL ASSOCIATION OF WATER
- Page 6 and 7:
----Water ComparedExecutive Summary
- Page 8 and 9:
Water ComparedExecutive SummaryAs u
- Page 10 and 11:
Water ComparedExecutive SummaryUtil
- Page 12 and 13:
Water ComparedExecutive SummaryII !
- Page 15 and 16: Water ComparedExecutive SummaryAppe
- Page 17 and 18: Water ComparedIntroduction1. Introd
- Page 19 and 20: Water ComparedIntroductionThe inves
- Page 21 and 22: Water ComparedIndustries Compared2.
- Page 23 and 24: Water ComparedIndustries Comparedo
- Page 25 and 26: Water ComparedIndustries ComparedTa
- Page 27 and 28: Water ComparedIndustries ComparedTh
- Page 29 and 30: Water ComparedIndustries ComparedEc
- Page 31 and 32: Water ComparedIndustries ComparedEl
- Page 33 and 34: Water ComparedIndustries ComparedCu
- Page 35 and 36: Water ComparedIndustries ComparedA
- Page 37 and 38: Water ComparedIndustries ComparedTh
- Page 39 and 40: Water ComparedIndustries ComparedEc
- Page 41 and 42: Water ComparedIndustries ComparedTa
- Page 43 and 44: Water ComparedIndustries ComparedLo
- Page 45 and 46: Water ComparedIndustries ComparedAs
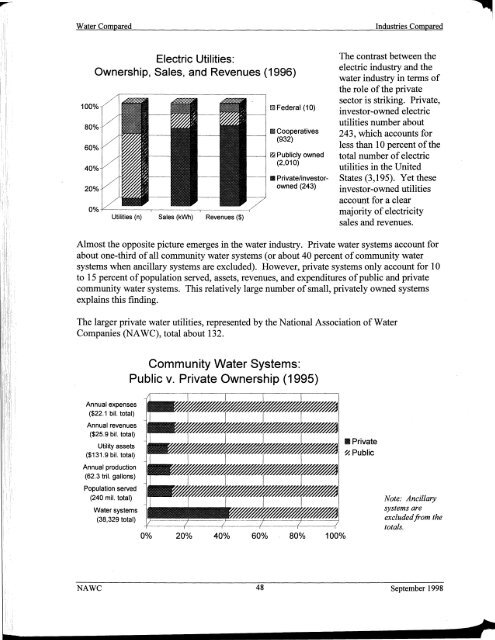
- Page 47 and 48: Water ComparedIndustries Compared9.
- Page 49 and 50: Water ComparedIndustries ComparedWh
- Page 51 and 52: Water ComparedIndustries ComparedTr
- Page 53 and 54: Water ComparedIndustries ComparedLi
- Page 55 and 56: Water ComparedIndustries Compared
- Page 57 and 58: Water ComparedIndustries ComparedTo
- Page 59 and 60: Water ComparedIndustries Comparedoo
- Page 61 and 62: Water ComparedIndustries ComparedTa
- Page 63: -----------~~~-Water ComparedIndust
- Page 67 and 68: Water ComparedIndustries ComparedPu
- Page 69 and 70: Water ComparedStructural Change3. S
- Page 71 and 72: Water ComparedStructural ChangeObse
- Page 73 and 74: Water ComparedStructural ChangeIndu
- Page 75 and 76: Water ComparedStructural ChangelMan
- Page 77 and 78: Water ComparedStructoral ChangeDesp
- Page 79 and 80: Water ComparedStructural ChangeRest
- Page 81 and 82: --lWater ComparedStructural Changeg
- Page 83 and 84: lWater Compared Structoral ChangeIn
- Page 85 and 86: Water ComparedStructural ChangeoooA
- Page 87 and 88: Water ComparedStructural ChangeTabl
- Page 89 and 90: Water ComparedStructoral ChangeTabl
- Page 91 and 92: Water ComparedStructural ChangeTabl
- Page 93 and 94: Water ComparedStructural ChangeTabl
- Page 95 and 96: Water ComparedAlternative Models4.
- Page 97 and 98: Water ComparedAlternative ModelsReg
- Page 99 and 100: Water ComparedAlternative ModelsFin
- Page 101 and 102: Water ComparedAlternative ModelsIn
- Page 103 and 104: Altematlve ModelsTable 4-5: Regulat
- Page 105 and 106: Water ComparedAlternative ModelsTab
- Page 107 and 108: Water ComparedAlternative ModelsTab
- Page 109 and 110: Water ComparedAlternative Models;iT
- Page 111 and 112: Water ComparedAlternative ModelslIT
- Page 113 and 114: Water ComparedStrategic Issues5. St
- Page 115 and 116:
Water ComparedStrategic IssuesTable
- Page 117 and 118:
Water ComparedStrategic IssuesTable
- Page 119 and 120:
Water ComparedAppendix AAppendix A:
- Page 121 and 122:
Water ComparedAppendix AState Telec
- Page 123 and 124:
Water ComparedAppendix AStateColora
- Page 125 and 126:
Water ComparedAppendix AState Telec
- Page 127 and 128:
Water ComparedAppendix AStateIllino
- Page 129 and 130:
Water Compared AooendixAlState Tele
- Page 131 and 132:
Water ComparedAooendix AState Telec
- Page 133 and 134:
Water ComparedAppendix AState Telec
- Page 135 and 136:
Water ComparedAppendix AStateMissis
- Page 137 and 138:
Water Compared Appendix Al),•Stat
- Page 139 and 140:
Water ComparedAppendix AState Telec
- Page 141 and 142:
Water ComparedAppendix AState Telec
- Page 143 and 144:
Water ComparedAppendix AState Telec
- Page 145 and 146:
Water Compared Appendix A lState Te
- Page 147 and 148:
Water ComparedAppendix AState Telec
- Page 149 and 150:
Water ComparedAppendix AState Telec
- Page 151 and 152:
Water ComparedAppendix AState Telec
- Page 153 and 154:
Water ComparedAppendix AState Telec
- Page 155 and 156:
Water ComparedAppendix BAppendix BR
- Page 157 and 158:
Water ComparedAppendix BTable B-2Ke
- Page 159 and 160:
Water ComparedAppendix CAppendix CS
- Page 161 and 162:
Water ComparedAooendix CTable C-2Pe
- Page 163 and 164:
Water ComparedAppendixCTable C-2 (c
- Page 165 and 166:
Water ComparedData SourcesData Sour
- Page 167 and 168:
Water ComparedData SourcesData Sour
- Page 169 and 170:
Water ComparedData SourcesData Sour
- Page 171 and 172:
-~------Water ComparedGlossaryGloss
- Page 173 and 174:
Water ComparedGlossaryincluding dem
- Page 175 and 176:
Water ComparedGlossarymay apply to
- Page 177 and 178:
Water ComparedGlossaryReseller. In