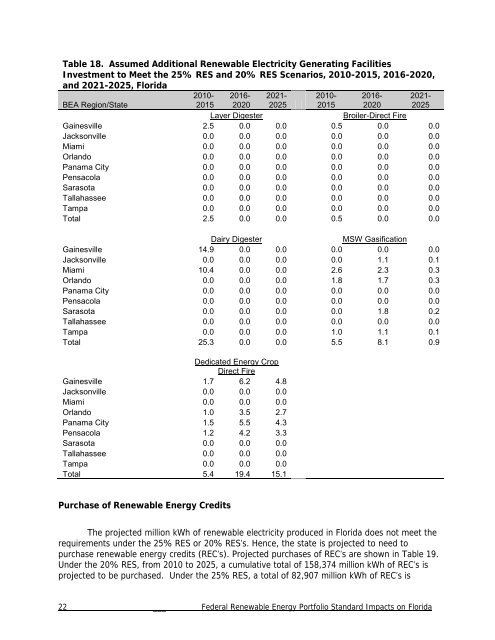
Table 18. Assumed Additional Renewable Electricity Generating FacilitiesInvestment to Meet the 25% RES and 20% RES Scenarios, 2010-2015, 2016-2020,and 2021-2025, <strong>Florida</strong>BEA Region/State2010-20152016-20202021-20252010-20152016-20202021-2025Layer DigesterBroiler-Direct FireGainesville 2.5 0.0 0.0 0.5 0.0 0.0Jacksonville 0.0 0.0 0.0 0.0 0.0 0.0Miami 0.0 0.0 0.0 0.0 0.0 0.0Orlando 0.0 0.0 0.0 0.0 0.0 0.0Panama City 0.0 0.0 0.0 0.0 0.0 0.0Pensacola 0.0 0.0 0.0 0.0 0.0 0.0Sarasota 0.0 0.0 0.0 0.0 0.0 0.0Tallahassee 0.0 0.0 0.0 0.0 0.0 0.0Tampa 0.0 0.0 0.0 0.0 0.0 0.0Total 2.5 0.0 0.0 0.5 0.0 0.0Dairy DigesterMSW GasificationGainesville 14.9 0.0 0.0 0.0 0.0 0.0Jacksonville 0.0 0.0 0.0 0.0 1.1 0.1Miami 10.4 0.0 0.0 2.6 2.3 0.3Orlando 0.0 0.0 0.0 1.8 1.7 0.3Panama City 0.0 0.0 0.0 0.0 0.0 0.0Pensacola 0.0 0.0 0.0 0.0 0.0 0.0Sarasota 0.0 0.0 0.0 0.0 1.8 0.2Tallahassee 0.0 0.0 0.0 0.0 0.0 0.0Tampa 0.0 0.0 0.0 1.0 1.1 0.1Total 25.3 0.0 0.0 5.5 8.1 0.9Dedicated Energy CropDirect FireGainesville 1.7 6.2 4.8Jacksonville 0.0 0.0 0.0Miami 0.0 0.0 0.0Orlando 1.0 3.5 2.7Panama City 1.5 5.5 4.3Pensacola 1.2 4.2 3.3Sarasota 0.0 0.0 0.0Tallahassee 0.0 0.0 0.0Tampa 0.0 0.0 0.0Total 5.4 19.4 15.1Purchase of Renewable Energy CreditsThe projected million kWh of renewable electricity produced in <strong>Florida</strong> does not meet therequirements under the 25% RES or 20% RES’s. Hence, the state is projected to need topurchase renewable energy credits (REC’s). Projected purchases of REC’s are shown in Table 19.Under the 20% RES, from 2010 to 2025, a cumulative total of 158,374 million kWh of REC’s isprojected to be purchased. Under the 25% RES, a total of 82,907 million kWh of REC’s is22 ___ Federal Renewable Energy Portfolio Standard Impacts on <strong>Florida</strong>
projected to be purchased. The REC’s purchases were allocated to BEA regions based uponcounty population for residential use and based upon county business patterns for commercialuse.Table 19. Projected Renewable Energy Credit Purchases Under the 20% RES and25% RES’s2010 2011 2012 2013 2014 2015 2016 2017 2018 2019 2020 2021 2022 2023 2024 2025(Million kWh)20% RES Requirement0 7,053 7,138 14,352 14,516 14,699 22,370 22,690 23,036 31,215 31,682 40,126 40,728 41,424 42,187 42,901Projected Renewable Energy Production 20% RES0 3,533 4,773 5,981 6,878 11,521 14,238 15,779 17,268 19,478 21,314 22,006 22,699 23,394 24,091 24,792Renewable Energy Credits 20% RES0 3,520 2,365 8,371 7,638 3,178 8,133 6,911 5,768 11,737 10,368 18,119 18,029 18,031 18,096 18,11025% RES Requirement0 0 8,154 8,198 11,746 11,895 15,618 15,841 20,468 20,801 26,391 26,740 32,569 33,126 36,949 48,622Projected Renewable Energy Production 25% RES0 0 4,773 5,981 6,878 11,521 14,238 15,779 17,268 19,478 21,314 22,006 22,699 23,394 24,091 24,792Renewable Energy Credits 25% RES0 0 3,381 2,217 4,868 374 1,380 62 3,200 1,324 5,077 4,733 9,870 9,732 12,858 23,830Economic Impacts: Investment and OperatingMultiple annual impacts accrue from development of a renewable energy industry. Theimpacts reported in this section include both the impacts of investing in and operating arenewable electricity industry. The impacts from the renewable electricity industry will come notonly from electricity generation, but also from production of feedstocks for renewable electricity.Therefore, impacts are also reported for harvesting dedicated energy crops, collecting livestockmanure, and of land shifts out of traditional crops to dedicated energy crops, and the impacts ofa change in electricity prices (assuming the increased cost of producing the renewable electricityis passed on to consumers). Impacts presented include total industry output, employment, andvalue-added to the state’s and BEA Regions’ economies.More detailed tables are presented in Appendix C, which display two types of impacts,direct and total. The direct impacts are the expenditures directly from the additions to demandfor a particular industry. The total impacts include the direct impacts along with impacts frommultiplier effects. These additional impacts include both indirect and induced. The indirectimpacts are those that result from the industry’s expenditures on input supplies and services.The induced impacts are those that result from those who are employed in the industry spendingtheir income in the study region.Economic Impacts: Investment in a Renewable Electricity IndustryBased upon the facilities numbers, facilities locations by BEA Region, and expenditures byrepresentative facilities shown in Appendix B, economic impacts are projected using IMPLAN.Economic impacts by BEA Region from the investment in additional renewable energy facilitiesunder each of the three policy scenarios are shown in Appendix C Tables C.1-C.3. Table C.1Federal Renewable Energy Portfolio Standard Impacts on <strong>Florida</strong> ___ 23