

Florida Study - Bipartisan Policy Center
Florida Study - Bipartisan Policy Center
Florida Study - Bipartisan Policy Center

You also want an ePaper? Increase the reach of your titles
YUMPU automatically turns print PDFs into web optimized ePapers that Google loves.
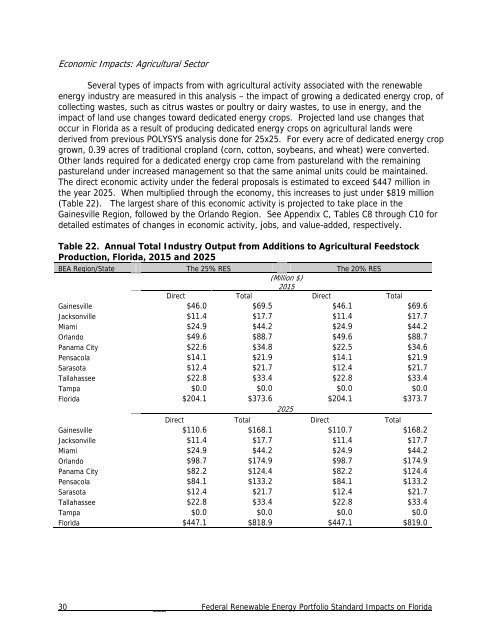
Economic Impacts: Agricultural SectorSeveral types of impacts from with agricultural activity associated with the renewableenergy industry are measured in this analysis – the impact of growing a dedicated energy crop, ofcollecting wastes, such as citrus wastes or poultry or dairy wastes, to use in energy, and theimpact of land use changes toward dedicated energy crops. Projected land use changes thatoccur in <strong>Florida</strong> as a result of producing dedicated energy crops on agricultural lands werederived from previous POLYSYS analysis done for 25x25. For every acre of dedicated energy cropgrown, 0.39 acres of traditional cropland (corn, cotton, soybeans, and wheat) were converted.Other lands required for a dedicated energy crop came from pastureland with the remainingpastureland under increased management so that the same animal units could be maintained.The direct economic activity under the federal proposals is estimated to exceed $447 million inthe year 2025. When multiplied through the economy, this increases to just under $819 million(Table 22). The largest share of this economic activity is projected to take place in theGainesville Region, followed by the Orlando Region. See Appendix C, Tables C8 through C10 fordetailed estimates of changes in economic activity, jobs, and value-added, respectively.Table 22. Annual Total Industry Output from Additions to Agricultural FeedstockProduction, <strong>Florida</strong>, 2015 and 2025BEA Region/State The 25% RES The 20% RES(Million $)2015Direct Total Direct TotalGainesville $46.0 $69.5 $46.1 $69.6Jacksonville $11.4 $17.7 $11.4 $17.7Miami $24.9 $44.2 $24.9 $44.2Orlando $49.6 $88.7 $49.6 $88.7Panama City $22.6 $34.8 $22.5 $34.6Pensacola $14.1 $21.9 $14.1 $21.9Sarasota $12.4 $21.7 $12.4 $21.7Tallahassee $22.8 $33.4 $22.8 $33.4Tampa $0.0 $0.0 $0.0 $0.0<strong>Florida</strong> $204.1 $373.6 $204.1 $373.72025Direct Total Direct TotalGainesville $110.6 $168.1 $110.7 $168.2Jacksonville $11.4 $17.7 $11.4 $17.7Miami $24.9 $44.2 $24.9 $44.2Orlando $98.7 $174.9 $98.7 $174.9Panama City $82.2 $124.4 $82.2 $124.4Pensacola $84.1 $133.2 $84.1 $133.2Sarasota $12.4 $21.7 $12.4 $21.7Tallahassee $22.8 $33.4 $22.8 $33.4Tampa $0.0 $0.0 $0.0 $0.0<strong>Florida</strong> $447.1 $818.9 $447.1 $819.030 ___ Federal Renewable Energy Portfolio Standard Impacts on <strong>Florida</strong>