

Florida Study - Bipartisan Policy Center
Florida Study - Bipartisan Policy Center
Florida Study - Bipartisan Policy Center

You also want an ePaper? Increase the reach of your titles
YUMPU automatically turns print PDFs into web optimized ePapers that Google loves.
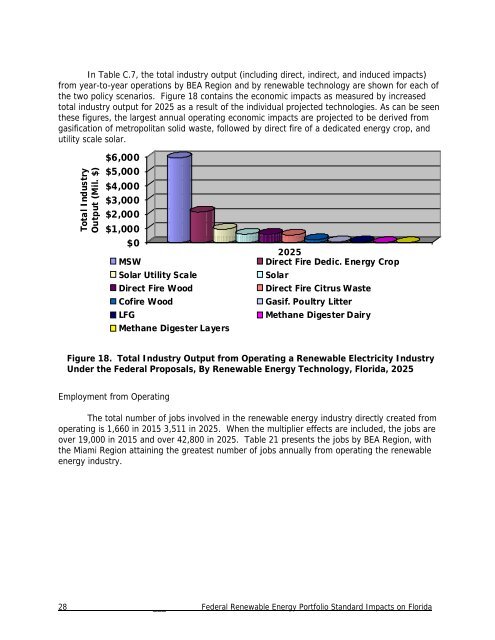
In Table C.7, the total industry output (including direct, indirect, and induced impacts)from year-to-year operations by BEA Region and by renewable technology are shown for each ofthe two policy scenarios. Figure 18 contains the economic impacts as measured by increasedtotal industry output for 2025 as a result of the individual projected technologies. As can be seenthese figures, the largest annual operating economic impacts are projected to be derived fromgasification of metropolitan solid waste, followed by direct fire of a dedicated energy crop, andutility scale solar.Total IndustryOutput (Mil. $)$6,000$5,000$4,000$3,000$2,000$1,000$0MSWSolar Utility ScaleDirect Fire WoodCofire WoodLFGMethane Digester Layers2025Direct Fire Dedic. Energy CropSolarDirect Fire Citrus WasteGasif. Poultry LitterMethane Digester DairyFigure 18. Total Industry Output from Operating a Renewable Electricity IndustryUnder the Federal Proposals, By Renewable Energy Technology, <strong>Florida</strong>, 2025Employment from OperatingThe total number of jobs involved in the renewable energy industry directly created fromoperating is 1,660 in 2015 3,511 in 2025. When the multiplier effects are included, the jobs areover 19,000 in 2015 and over 42,800 in 2025. Table 21 presents the jobs by BEA Region, withthe Miami Region attaining the greatest number of jobs annually from operating the renewableenergy industry.28 ___ Federal Renewable Energy Portfolio Standard Impacts on <strong>Florida</strong>