Detailed Version - Volkswagen AG
Detailed Version - Volkswagen AG
Detailed Version - Volkswagen AG

You also want an ePaper? Increase the reach of your titles
YUMPU automatically turns print PDFs into web optimized ePapers that Google loves.
5 Results of the Life Cycle Assessment<br />
Comparison of Life Cycle Impacts<br />
On the basis of the Life Cycle Inventory data, Life Cycle Impact Assessments are drawn<br />
up for all the environmental impact categories. The interactions of all the emissions<br />
recorded are considered and potential environmental impacts are determined based<br />
on scientific models (see Fig. 3).<br />
Diesel vehicles<br />
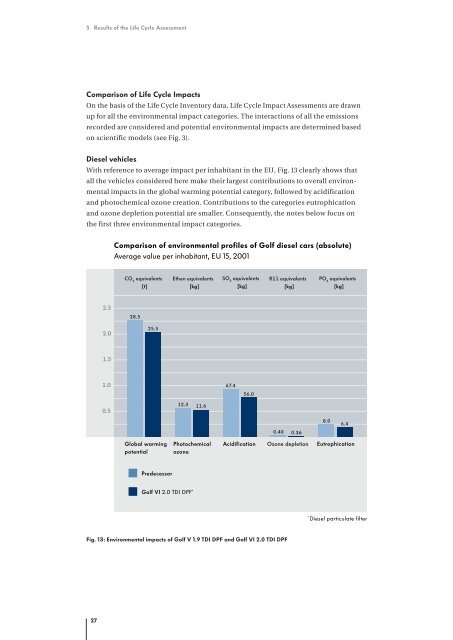
With reference to average impact per inhabitant in the EU, Fig. 13 clearly shows that<br />
all the vehicles considered here make their largest contributions to overall environmental<br />
impacts in the global warming potential category, followed by acidification<br />
and photochemical ozone creation. Contributions to the categories eutrophication<br />
and ozone depletion potential are smaller. Consequently, the notes below focus on<br />
the first three environmental impact categories.<br />
2.5<br />
2.0<br />
1.5<br />
1.0<br />
0.5<br />
Global warming<br />
potential<br />
Photochemical<br />
ozone<br />
Acidification Ozone depletion<br />
Fig. 13: Environmental impacts of Golf V 1.9 TDI DPF and Golf VI 2.0 TDI DPF<br />
27<br />
Comparison of environmental profiles of Golf diesel cars (absolute)<br />
Average value per inhabitant, EU 15, 2001<br />
CO 2 equivalents<br />
[t]<br />
28.5<br />
25.5<br />
Predecessor<br />
Ethen equivalents<br />
[kg]<br />
12.3 11.6<br />
Golf VI 2.0 TDI DPF *<br />
SO 2 equivalents<br />
[kg]<br />
67.4<br />
56.0<br />
R11 equivalents<br />
[kg]<br />
0.40 0.36<br />
PO 4 equivalents<br />
[kg]<br />
8.0<br />
6.4<br />
Eutrophication<br />
* Diesel particulate filter