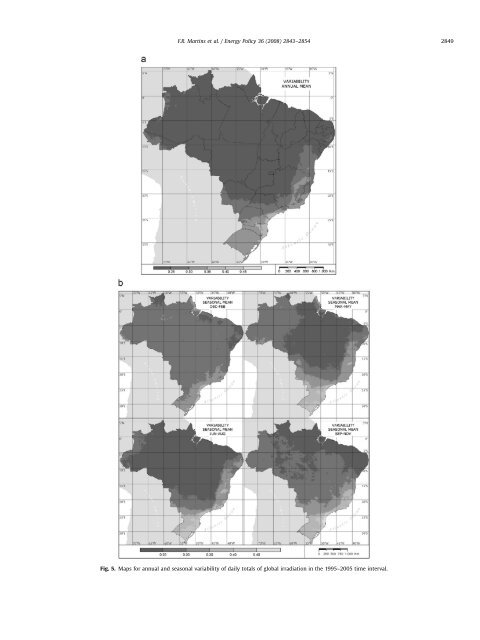
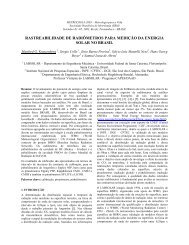
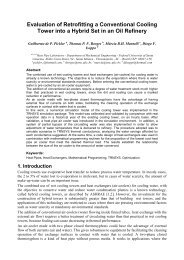
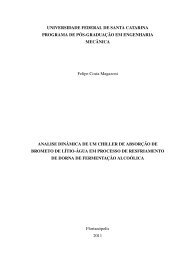
ARTICLE IN PRESS2848F.R. Mart<strong>in</strong>s et al. / Energy Policy 36 (2008) 2843–2854Fig. 4. Maps for annual precipitation and nebulosity <strong>in</strong> the <strong>Brazil</strong>ian territory based <strong>in</strong> ground data collected <strong>in</strong> a 60-year period (1931–1990). Source: <strong>Brazil</strong>ian Institute forMeteorology (INMET, 2007).irradiation for day d of year y from its annual mean <strong>in</strong> the sameyear. I d stands for the mean daily solar flux for the same day d <strong>in</strong>the time period from 1995 to 2005. V d,y can be understood as themean value of the ratio between SD d and I d .V annual ¼ V d;yN dwhere¼P 365d¼1 SD d=I dN dsPffiffiffiffiffiffiffiffiffiffiffiffiffiffiffiffiffiffiffiffiffiffiffiffiffiffiffiffiffiffiffiffiffiffiffiffiffiffiffi2005y¼1995SD d ¼ðI d;y I y Þ 2and I d ¼N yP 2005y¼1995 I d;yNyThe seasonal variability, V seasonal , was def<strong>in</strong>ed as the mean <strong>in</strong>traseasonalvariability, V sea,y , observed for each year <strong>in</strong> the1995–2005 period. The <strong>in</strong>tra-seasonal variability, V sea,y for aspecific year was determ<strong>in</strong>ed through the ratio between themean quadratic deviation, SD sea,y , and the mean value of the dailysolar flux for a specific season, I sea,y , as presented <strong>in</strong> Eq. (3):P 2005y¼1995V seasonal ¼V sea;yN ywhereV sea;y ¼ SD sea;yI sea;ysPffiffiffiffiffiffiffiffiffiffiffiffiffiffiffiffiffiffiffiffiffiffiffiffiffiffiffiffiffiffiffiffiffiffiffiffiffiffiffiffiff<strong>in</strong>2d¼n1SD sea;y ¼ðI d;y I sea;y Þ 2P n2d¼n1and I sea;y ¼I d;sea(3)N d;seaN d;seaAnalyz<strong>in</strong>g the annual variability map, <strong>one</strong> may notice that theentire Amazon and the Central regions <strong>in</strong>clud<strong>in</strong>g the westernportion of the Northeastern region show lower variabilitythroughout the year—less than 25%. These regions show dist<strong>in</strong>ctiveclimate characteristics that reduce the solar flux variabilitythroughout the year as for example the low nebulosity allthrough the year <strong>in</strong> the semi-arid region and the high nebulositydur<strong>in</strong>g the summer <strong>in</strong> the Amazon region.It can be verified that the seasonal variability shows the samepattern observed for the annual variability. The entire Central–-North area of the country—the Amazon, the Cerrado area, thesemi-arid region <strong>in</strong> <strong>Brazil</strong>ian Northeast and the western part ofthe Southeast region—show the smallest seasonal variability. Thevariability is lower dur<strong>in</strong>g the w<strong>in</strong>ter (June through August) andlarger <strong>in</strong> the summer (from December till February). This behaviorreflects the nebulosity variation all through the year. Dur<strong>in</strong>g the(2)w<strong>in</strong>ter the ra<strong>in</strong> precipitation is low <strong>in</strong> this entire region and thenumber of days with clear skies is greater, thereby reduc<strong>in</strong>g thevariability of solar irradiation <strong>in</strong> the region. The presence of largenebulosity dur<strong>in</strong>g the summer expla<strong>in</strong>s the larger variability ofsolar irradiation with<strong>in</strong> this period.On the other hand, the Southern and coastal area of Southeasternregions presents higher annual variability, around 45%,due to the <strong>in</strong>cursions of cold fronts orig<strong>in</strong>at<strong>in</strong>g from the deepcyclonic systems <strong>in</strong> the Antarctic region, ma<strong>in</strong>ly <strong>in</strong> fall and w<strong>in</strong>terseasons. The coastal regions of the South and Southeast show thelargest variability dur<strong>in</strong>g all seasons of the year.Fig. 6 allows a comparison of the <strong>in</strong>ter-annual variability of theannual and seasonal averages of daily global solar irradiation foreach of the <strong>Brazil</strong>ian political regions. The central squaresrepresent the averages <strong>in</strong> the 10-year period, the outer largersquares represents the range for confidence level equal to 67%(<strong>one</strong> standard deviation) and the vertical bars show the limits forconfidence level of 95%.In the box plot presented <strong>in</strong> Fig. 6(a), it can be noted that theNortheast region presented the smallest <strong>in</strong>ter-annual variability(between 5.7 and 6.1 kWh/m 2 /day) followed by the North region(between 5.2 and 5.8 kWh/m 2 /day). Dur<strong>in</strong>g the 10-year periodanalyzed, the South region showed larger <strong>in</strong>ter-annual variabilitywith annual mean solar flux vary<strong>in</strong>g between 4.6 and 5.6 kWh/m 2 /day.From box plots presented <strong>in</strong> Fig. 6(b) to (e), <strong>one</strong> can observethat the Southern region also presents the largest seasonalvariability. It is worth not<strong>in</strong>g that the mean solar radiation flux<strong>in</strong> summer is about 65% larger than it is <strong>in</strong> w<strong>in</strong>ter <strong>in</strong> this region.The North region presented the lowest seasonal variability allthrough the year with the m<strong>in</strong>imum variability <strong>in</strong> the spr<strong>in</strong>g (from5.7 till 6.1 kWh/m 2 /day) and the maximum at the w<strong>in</strong>ter (from 4.8till 6.0 kWh/m 2 /day).The fall and w<strong>in</strong>ter seasons showed the largest <strong>in</strong>ter-annualvariability <strong>in</strong> all regions of <strong>Brazil</strong> (larger spread<strong>in</strong>g measured bythe distance between bars on the figure). The frontal systems aresupposed to be the ma<strong>in</strong> reason for this larger variability <strong>in</strong> theSouth and Southeastern regions. The <strong>in</strong>crease <strong>in</strong> nebulosityresult<strong>in</strong>g from the <strong>in</strong>cursion of frontal systems causes a noticeablereduction of solar irradiation dur<strong>in</strong>g several consecutive days. Thereason for the variability <strong>in</strong>crease observed dur<strong>in</strong>g the fall andw<strong>in</strong>ter seasons <strong>in</strong> the North and Midwest regions is not clear.A larger quantity of clear sky days can be observed (lessnebulosity) <strong>in</strong> these regions dur<strong>in</strong>g the dry season (fall and
ARTICLE IN PRESSF.R. Mart<strong>in</strong>s et al. / Energy Policy 36 (2008) 2843–2854 2849Fig. 5. Maps for annual and seasonal variability of daily totals of global irradiation <strong>in</strong> the 1995–2005 time <strong>in</strong>terval.