Tree Configuration Thermosyphon Study - LEPTEN
Tree Configuration Thermosyphon Study - LEPTEN
Tree Configuration Thermosyphon Study - LEPTEN

You also want an ePaper? Increase the reach of your titles
YUMPU automatically turns print PDFs into web optimized ePapers that Google loves.
<strong>Tree</strong> <strong>Configuration</strong> <strong>Thermosyphon</strong> <strong>Study</strong><br />
Marcia B. H. Mantelli * , Fernando H. Milanez † and Gregor Mielitz ‡<br />
Federal University of Santa Catarina, Florianopolis, SC, Brazil 88040-900<br />
This work present a study on the tree configuration thermosyphon, which is composed by<br />
four parallel condensers and a single evaporator. The objective of the work is to analyze the<br />
applicability of the thermosyphon of to systems where one is interested in homogenizing the<br />
temperature inside enclosures, such as domestic and industrial ovens. A prototype of the tree<br />
configuration thermosyphon was built and tested under both natural and forced convection<br />
cooling over the condenser. The results show that for the natural convection tests, the<br />
evaporator can easily spread the vapor evenly through all the condensers, homogenizing the<br />
condensers temperatures. The same was not observed for the forced convection tests, where<br />
due to the high heat transfer coefficient not the entire condenser is necessary to dissipate the<br />
power input. As a consequence the vapor tends to concentrate in a small portion of the<br />
condenser. The measured condenser resistance was compared with models and correlations<br />
available in the literature. The results show that the overall thermal resistance of the<br />
condensers is larger than predicted by the modeling employed. However, the larger the<br />
power input, the smaller the differences between the model and experiments. The results<br />
suggest that the thermosyphon is over-dimensioned for the heat transfer levels encountered<br />
in domestic ovens. Despite the differences, the absolute value of the thermosyphon overall<br />
thermal resistance is actually very low, which demonstrates the device can be applied to<br />
isothermalize ovens and furnaces where natural convection of air is responsible for<br />
removing the heat being transferred by the thermosyphon.<br />
Nomenclature<br />
d = thermosyphon tube diameter [m]<br />
g = gravity acceleration =9.81 m/s²<br />
h = heat transfer coefficient [W/m²⋅K]<br />
h lv = vaporization enthalpy [J/kg]<br />
k = thermal conductivity [W/m⋅K]<br />
l = length [m]<br />
Nu = Nusselt number (Eq. 7)<br />
Nu * = modified Nusselt number (Eq. 5)<br />
Pr = Prandtl number<br />
q = total heat transfer rate in the tree configuration thermosyphon [W]<br />
Q = heat transfer rate in a conventional thermosyphon [W]<br />
r = thermosyphon tube radius [m]<br />
R = thermal resistance [°C/W]<br />
Re = Reynolds number<br />
T = temperature [°C]<br />
Greek symbols<br />
ρ = density [kg/m³]<br />
µ = dynamic viscosity [Pa.s]<br />
ν = kinematic viscosity [m²/s]<br />
* Professor, Department of Mechanical Engineering, Satellite Thermal Control Group, marcia@labsolar.ufsc.br.<br />
† Research Engineer, Department of Mechanical Engineering, Satellite Thermal Control Group,<br />
milanez@labsolar.ufsc.br.<br />
‡ Research Assistant, Department of Mechanical Engineering, Satellite Thermal Control Group.<br />
1<br />
American Institute of Aeronautics and Astronautics
Subscripts<br />
a = adiabatic zone<br />
c = condenser, condensation<br />
e = evaporator, external<br />
f = condensation film<br />
i = internal<br />
l = liquid<br />
t = thermosyphon, tube<br />
v = vapor<br />
I. Introduction<br />
wo-phase thermosyphons are high efficiency heat transfer devices. The thermosyphon technology can be found<br />
T in several heat transfer equipment, where a better temperature distribution and/or a large heat transfer capacity<br />
are desired. These equipment include heat exchangers, industrial and domestic ovens, vapor generators, etc. The<br />
LABSOLAR/NCTS Laboratory at the Federal University of Santa Catarina, in Brazil, is working on heat pipe and<br />
thermosyphon research since 1990 under funding of the Brazilian Space Agency, Petrobrás and other industries.<br />
A typical thermosyphon consists of a metallic tube with both ends closed and filled with a certain amount of<br />
working fluid. Before filling the thermosyphon with the working fluid, the thermosyphon is evacuated so that,<br />
during operation, its internal volume is filled only with a saturated liquid-vapor mixture. The thermosyphon presents<br />
three typical regions: evaporator, adiabatic zone and condenser. Under operation, most of the liquid is in the<br />
evaporator, which is the region where the working fluid absorbs heat. The heat crosses the tube walls and reaches<br />
the liquid by conduction. The working fluid vaporizes and, due to pressure gradients, flows through the adiabatic<br />
zone, reaching the condenser. In the condenser, the vapor liquefies, releases latent heat and condenses on the internal<br />
walls of the tube. Gravity pulls the liquid film back to the evaporator, completing a thermodynamic cycle. The heat<br />
released during the vapor condensation crosses the tube walls by conduction and is rejected to the heat sink.<br />
The thermosyphon thermal resistance is very low because during liquid-vapor phase change there is no<br />
temperature variation. The thermal resistance of the thermosyphon is basically determined by the thermal resistances<br />
of conduction through the tube walls and by the thermal resistances of vaporization and condensation of the working<br />
fluid, which are generally very small.<br />
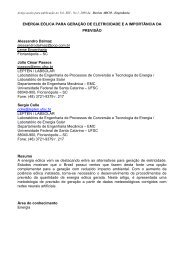
The tree configuration thermosyphon consists of several vertical thermosyphon condensers connected to a<br />
common evaporator in the horizontal position, as shown in Fig. 2. For applications such as bakery ovens, there are<br />
many advantages associated to this configuration instead of several parallel conventional thermosyphons. As there is<br />
only one evaporator, it is easy to transfer the heat to the working fluid by means of a single heater, which can be a<br />
gas burner or an electrical heater located underneath the evaporator. Also, the geometry of the evaporator allows for<br />
a more effective heat transfer from the oven’s gas burner to the evaporator. The vapor generated in the evaporator is<br />
evenly distributed among all the condensers. The temperature levels of the several condensers are similar to each<br />
other because they all have a common vapor core in the evaporator, as will be seen later. A disadvantage of this<br />
configuration could be a more complex manufacturing.<br />
The main objective of this work is to test the conception of the tree configuration. The main focus will be on the<br />
behavior of the parallel condensers. Experimental data from a prototype will be presented and analyzed, and the<br />
condensation process will be compared with correlations available in the literature.<br />
II. Modeling the <strong>Thermosyphon</strong> Thermal Resistance<br />
Given the complexity and the dependency of the physical phenomena appearing during the operation of the<br />
thermosyphon, such as boiling, condensation and vapor and liquid flows, the theoretical modeling of the<br />
thermosyphon can be very difficult. Each one of these processes presents complexities that make them difficult to<br />
predict, even when treated separately one from the other. When acting simultaneously in a confined space, the<br />
complexity increases even more. The literature presents some attempts to model the temperature and the pressure<br />
fields inside the thermosyphon using numerical methods (see Faghri 1 ). The lack of flexibility and the high level of<br />
complexity of these types of models make simplified models such as the equivalent electric circuit model to be<br />
preferred. Furthermore, for application on engineering problems, one is usually interested on the global thermal<br />
resistance of the thermosyphon, and not on small details inside the thermosyphon. The thermal resistance of the<br />
thermosyphon R t [K/W] is defined as:<br />
2<br />
American Institute of Aeronautics and Astronautics
Te<br />
−Tc<br />
Rt<br />
= (1)<br />
Q<br />
where T e and T c [K] are the evaporator and condenser average temperatures, respectively, and Q [W] is the<br />
thermosyphon rate of heat transfer.<br />
Condensers<br />
Evaporator<br />
Water feeding tube<br />
Figure 1. Schematic of the tree configuration thermosyphon<br />
In the equivalent electric circuit model, the thermosyphon total thermal resistance is computed as an association<br />
of the resistances of the individual heat transfer processes inside the thermosyphon. A model for vertical normal<br />
configuration thermosyphon in steady state conditions, which uses the analogy with electrical circuits, can be found<br />
in the literature (see Mantelli et al. 2 ) is represented in Fig. 2. In the equivalent electric circuit model, the<br />
thermosyphon total thermal resistance is computed as an association of the resistances of the individual heat transfer<br />
processes inside the thermosyphon.<br />
Figure 2. <strong>Thermosyphon</strong> equivalent electric circuit<br />
Resistances R 1 and R 7 correspond to the radial conduction through the tube walls in the evaporator and in the<br />
condenser, respectively. For a circular tube, these resistances are easily calculated as:<br />
ln( re<br />
/ ri<br />
)<br />
R1 = 2π k l<br />
(2)<br />
t e<br />
3<br />
American Institute of Aeronautics and Astronautics
( r / r )<br />
ln e i<br />
R7 = 2π k l<br />
(3)<br />
t c<br />
The R 6 resistance is related to the process of vapor condensation in the internal walls of the condenser. It is<br />
defined as the difference between the temperature of the saturated vapor and the temperature of the internal wall of<br />
the condenser divided by the rate of heat released during the condensation of the vapor. As presented by Incropera<br />
and de Witt 3 and Bejan 4 , among others, Nusselt was the first researcher to model the process of condensation on a<br />
vertical wall for the case of laminar liquid film flow and in the absence of shear stresses at the interface liquid-vapor.<br />
Faghri 1 presents a simple correlation for Nusselt’s laminar condensation model, which can be written in the<br />
following form:<br />
1<br />
3<br />
*<br />
⎛ Re f ⎞<br />
Nu = 0.925 ⎜ ⎟<br />
4<br />
(4)<br />
⎝ ⎠<br />
where the modified Nusselt number (Nu * ) and the liquid film Reynolds number (Re f ) are defined, respectively, as:<br />
1<br />
3<br />
2<br />
* h ⎡<br />
⎤<br />
c ν l<br />
⎛ ρ ⎞<br />
Nu ⎢<br />
⎜<br />
l<br />
≡<br />
⎟⎥<br />
(5)<br />
kl<br />
⎢⎣<br />
g ⎝ ρl<br />
− ρv<br />
⎠⎥⎦<br />
4Q<br />
Re f = , (6)<br />
π d h µ<br />
i<br />
lv<br />
l<br />
Faghri 1 also presents extensions of the Nusselt laminar condensation theory that take into account for the shear<br />
stresses resulting from the vapor flowing in the opposite direction to the liquid film. According to Faghri 1 , the<br />
falling film is laminar for Re f < 30 and turbulent for Re f > 2000. For 30 < Re f < 1300 the flow is wavy-laminar,<br />
which means laminar flow with waves on the film surface. In most the applications, the falling film flow is turbulent<br />
or wavy-laminar and the heat transfer coefficients are larger than that in the laminar regime. However, the analytical<br />
modeling of these phenomena is difficult and normally correlations obtained from experimental data are used to<br />
predict the heat transfer coefficients during condensation. Faghri 1 and Mantelli et al. 2 , among others, present<br />
comparative studies between different correlations and models for the condensation heat transfer coefficients for<br />
applications in thermosyphons. Differences of up to one order of magnitude are observed between the different<br />
available correlations and models in the literature. Mantelli et al. (1999) also presented measurements of the<br />
condensation heat transfer coefficients obtained from a thermosyphon with similar characteristics to the one<br />
employed in this application. These authors show that the correlation proposed by Kaminaga et al. 5 was the one that<br />
better predicted their experimental data for the condenser. The correlation of Kaminaga et al. 5 can be written in the<br />
following form:<br />
hcdi<br />
0.25 0.4<br />
Nu ≡ = 25 Re f Prl<br />
, (7)<br />
kl<br />
The condensation resistance can be then computed as:<br />
1<br />
R6 = hc<br />
2π ri<br />
l<br />
(8)<br />
c<br />
The R 2 resistance is related to the process of evaporation of the liquid. During the operation of the<br />
thermosyphon, the liquid pool generally does not fill the entire volume of the evaporator, or either, part of the<br />
internal wall of the evaporator is coated by the condensed film that returns from the condenser. Therefore, the<br />
thermal resistance of the evaporator is the association of two resistences in parallel: the resistance of evaporation of<br />
the condensed film and the resistance of evaporation of the liquid pool.<br />
The process of evaporation of a liquid film in a vertical wall is similar to the process of film condensation. The<br />
results of the Nusselt condensation laminar film theory has been used (Faghri 1 , Brost 6 ) to predict the exchange of<br />
heat associated to the evaporation of the liquid film on the walls of the evaporator. Other correlations have been<br />
proposed for the specific process of evaporation in thermosyphons based on the Nusselt theory and that take into<br />
account also for the effect of the diameter of the pipe and the presence of nucleate boiling at the interface between<br />
the tube wall and of the liquid film, as described by Faghri 1 . The heat transfer coefficients calculated according with<br />
the Nusselt theory are generally larger than observed experimentally in thermosyphons, because the condensed film<br />
is broken and transformed into rivulets of liquid, which dries part of the evaporator wall. On the other hand, when<br />
the evaporator heat flux is high, nucleate boiling occurs in the rivulets. When the vapor bubbles inside the liquid<br />
4<br />
American Institute of Aeronautics and Astronautics
low up, the rivulets are broken and liquid is spread all around the evaporator, wetting the entire internal wall and<br />
increasing the heat transfer coefficient (see Faghri 1 for more details).<br />
The R 3 and R 5 resistances shown in the equivalent circuit of Fig. 2 appear at the liquid-vapor interface in the<br />
evaporator and in the condenser, respectively. These resistances can generally be ignored (Brost 6 ). The resistance R 4<br />
is associated with the drop of saturation temperature of the vapor due to the pressure drop of the vapor flow between<br />
the evaporator and the condenser. In general, this resistance can also be neglected.<br />
Finally, the R 8 resistance is due to the axial heat conduction between the evaporator and the condenser through<br />
the tube walls. It can be estimated as the average length that the heat crosses between the evaporator and the<br />
condenser, which is the summation of half the length of the evaporator, half the length of the condenser and the<br />
length of the adiabatic section, divided by the thermal conductivity and by the cross-section area of the tube walls:<br />
( le<br />
+ lc<br />
) 2 + la<br />
R8<br />
=<br />
(9)<br />
2 2<br />
ktπ<br />
( re<br />
− ri<br />
)<br />
In general, the axial conduction resistance R 8 is much larger than the other resistances of the equivalent circuit of<br />
Fig. 2, and, as it is in parallel with resistances R 1 , R 2 , R 3 , R 4 , R 5 , R 6 and R 7 , which are associated in series, it can be<br />
neglected. As a result, the thermosyphon total thermal resistance is given by the summation in series of the<br />
resistances R 1 , R 2 , R 6 and R 7 . The thermophysical properties appearing in the above equations must be estimated at<br />
the average temperature of the thermosyphon, given by the arithmetic mean of the average temperatures of the<br />
evaporator and of the condenser.<br />
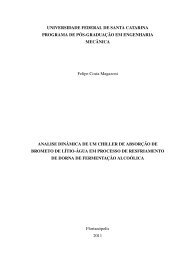
The complete equivalent electric circuit for the tree configuration thermosyphon is presented in Fig. 3(a). In this<br />
figure, q [W] is the total heat input to the thermosyphon, while q 1 ,q 2 , q 3 and q 4 are the heat rejected by each one of<br />
the condensers. Similarly, T c,1 , T c,2 , T c,3 , T c,4 are the averages of the condensers temperatures. These temperatures<br />
are, a priori, different from each other, specially when the vapor is not supplied equally among the different<br />
condensers. However, as it will be shown later in the experimental study, the condensers temperatures are practically<br />
equal to each other. In this modeling it is assumed that all the condensers are at the same temperature. Neglecting<br />
resistances R 3 , R 4 and R 5 , according to the discussion in the preceding paragraphs, and neglecting the thermal path by<br />
axial conduction through the tube walls, i. e., assuming R 8 much larger than the other resistances (actually it is<br />
approximately 3 to 4 orders of magnitude higher), one obtain a much simpler equivalent circuit, which is shown in<br />
Fig. 3(b). Also, the resistances associated to the condensation process inside each condenser (R 6,1 , R 6,2 , R 6,3 , R 6,4 ) are<br />
assumed to be equal to each other (R 6 ). This assumption is made based on Eqs. (4) to (6), which show that the<br />
condensation resistance is dependent on the thermophysical properties of the working fluid, which are dependent on<br />
the temperature level and also dependent on the heat transfer rate released during the condensation process.<br />
Assuming equal temperature levels and equal heat transfer rate for all the condensers, one can assume that the<br />
condensation resistances are equal for all the condensers.<br />
1<br />
2<br />
q = q + q + q + q<br />
1<br />
T [°C] T [°C] T [°C] T [°C]<br />
c,1 c,2 c,3 c,4<br />
2<br />
q [W] q [W] q [W] q [W]<br />
3<br />
3<br />
4<br />
4<br />
R R6,1<br />
R R<br />
7<br />
5,1 R7<br />
R6,2<br />
R 5,2<br />
R7<br />
R6,3<br />
R 5,3 R7<br />
R6,4<br />
R 5,4<br />
R7<br />
6<br />
R7<br />
R6<br />
R7<br />
R6<br />
R7<br />
R6<br />
q [W]<br />
T [°C]<br />
c<br />
R 4,1<br />
R 4,2<br />
R 4,3<br />
R 4,4<br />
R8,1<br />
R 8,2<br />
R R<br />
8,3<br />
8,4<br />
T [°C]<br />
v<br />
R 3<br />
R 2<br />
R 2<br />
R 1<br />
R 1<br />
T [°C]<br />
e<br />
T [°C]<br />
e<br />
q [W]<br />
(a)<br />
q [W]<br />
Figure 3. <strong>Tree</strong> configuration thermosyphon equivalent electric circuit:<br />
(a) complete circuit, (b) simplified circuit<br />
5<br />
American Institute of Aeronautics and Astronautics<br />
(b)
Since the main objective of this work is to analyze the condensation process inside the parallel condensers and<br />
due to difficulties in assessing the evaporation resistance with the experimental set-up employed in this study<br />
(discussed later), this work will be focused on the condenser resistance only. The condenser resistance R c is<br />
computed as:<br />
Tv<br />
− Tc<br />
R 6 + R<br />
R<br />
7<br />
c = =<br />
(10)<br />
q 4<br />
where T v [°C] is the temperature of the vapor inside the thermosyphon.<br />
III. Experimental <strong>Study</strong><br />
The tree configuration thermosyphon tested consists of four vertical condensers with a common evaporator. All<br />
tubes and caps were made of 0.2% carbon steel (AISI 1020 or C22 Standards) and connected by welding. The<br />
condensers are made of 21 mm external diameter tubes with a length of 634 mm, and the evaporator is made of a 42<br />
mm external diameter tube with a length of 408 mm. The thickness of the tube walls are 1,5 mm and 2,65 mm for<br />
the condenser and the evaporator, respectively. These dimensions are similar to other thermosyphon configurations<br />
already tested in the laboratory (Mantelli et al. 2 ). The external surface of the thermosyphon tube was electrogalvanized.<br />
The thermosyphon was evacuated to approximately 10 -3 mbar. The selected working fluid was distilled<br />
water due to many reasons: water is cheap, easy to obtain and presents good thermal properties. The fluid was<br />
charged by means of a small tube welded in the evaporator section, as it can be observed in Fig. 2. Approximately<br />
300 ml of distilled water was used to fill the evaporator to up to 70% of its internal volume.<br />
Experimental Set-up<br />
The experimental set up consists of a frame, a cooling circuit, a thermally insulated electrical heater, a power<br />
supply unit, thermocouples, a data acquisition unit and a personal computer for data storage. Figure 4(a) shows a<br />
picture of the experimental setup. A semi-cylindrical electrical resistance is attached to the bottom of the evaporator<br />
tube. Its temperature distribution as a function of its length was measured before mounting with the heater in<br />
stagnant air and it was found to be not uniform, with a maximum difference of approximately 125 K between the<br />
center and the tips of the heater. To reduce the heat losses to the surrounding environment, the evaporator tube and<br />
the assembled heater were insulated with two layers of 35mm thick glass wool. A closed water-cooling circuit is<br />
mounted around the condenser tubes to remove the heat from the thermosyphon. It has one entry and one exit tube<br />
which allow the flow of the refrigeration water from a controlled thermal bath. The setup was instrumented by<br />
means of 36 thermocouples, located according to Fig. 4 (b). After cleaning and charging, the tests described in Table<br />
2 were conducted. The following parameters were tested: heat power levels, use of natural convection (water or air)<br />
or forced convection (circulating water) in the condenser and temperatures of the water-cooling bath.<br />
Table 1. Parameters of the tree configuration thermosyphon tests<br />
Test Input power (W) Refrigeration Details<br />
A<br />
50, 100, 200, 300, 400, 500, Flowing water Power level change at -every 15 min; the<br />
600, 700, 800, 900, 1000 at 20 °C condenser heat is removed by forced convection<br />
B<br />
50, 100, 200, 300, 400, 500, Flowing water Power level change at every 15 min; the condenser<br />
600, 700, 800<br />
at 40 °C heat is removed by forced convection<br />
C 80 Stagnant air<br />
Condenser heat removed by air natural convection;<br />
air temperature increases with time<br />
D 500 Stagnant air<br />
E 150 Stagnant water<br />
Condenser heat removed by air natural convection;<br />
air temperature increases with time<br />
Condenser heat removed by water natural<br />
convection; water temperature increases with time<br />
6<br />
American Institute of Aeronautics and Astronautics
(a)<br />
(b)<br />
Figure 4. Experimental setup: picture (a) and thermocouple distribution (b)<br />
IV. Results and Discussion<br />
The data is presented in two main groups, according to the condensers cooling type: forced convection and<br />
natural convection. The forced convection tests (Tests A and B) are analyzed first. Then, the tests that used natural<br />
convection (Tests C, D and E) are presented.<br />
Forced convection tests<br />
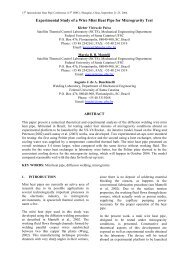
The temperature distribution for both forced convection tests (A and B) are very similar. Figure 5 shows some of<br />
the thermocouple readings of Test B as a function of time. The results and coments to be made for test B are valid<br />
for test A as well. The legend T16, T21, etc, refers to the thermocouple 16, 21, etc, according to Fig. 4 (b). The<br />
power input levels were increased every 15 minutes approximately (50, 100, 200, 300, 400, 500, 600, 700 and<br />
800W). One can observe that, for the first two power input levels (50 and 100W, which correspond to the first 30<br />
minutes) the temperatures did not reach steady state, as the temperature was still increasing by the time the next<br />
power level was increased. In this graph, the group of curves signaled as “Evaporator” are within a range of 5°C<br />
approximately and include T6 to T10 and T15, T20 and T25. Thermocouples T11, T16, T21 and T26 are located at<br />
the beginning of each condenser branch. Their temperature are lower than the evaporator temperatures and higher<br />
than the cooling fluid. As for the group of curves signaled “condenser + cooling fluid”, it includes the remaining<br />
condenser temperatures, i.e. T12 to T14, T17 to T19, T22 to T24 and T27 to 29 plus the cooling fluid temperatures<br />
(T1 to T5). As one can see these temperatures are very close to each other.<br />
From these results one can conclude that only a small portion of the condensers was active in Tests A and B. The<br />
vapor did not reach thermocouples T12, T17, T22 and T27 so most of the condensers length was inactive. The<br />
external convection heat transfer (water in forced convection) was so intense that only a small portion of the total<br />
available condenser length was necessary to dissipate the power input. One can also observe that T16 and T21,<br />
which correspond to the two condensers in the center of the evaporator, are approximately at the same temperature<br />
level, especially for time larger than 45 min, when the power input was larger than 300W. Thermocouples T26 and<br />
T11, which are the first and the last condensers, are at a lower level than the condensers of the center. Despite not<br />
being presented in Fig. 5, the temperatures of the electrical heater were not uniform either: T30=308°C, T31=326°C<br />
and T32=393°C for the highest power input level. That means the electrical heater provide a more intense heat flux<br />
near to T26 than near T11, which explains why T26 is larger than T11. However, T16 being larger than T26 is a<br />
surprise.<br />
7<br />
American Institute of Aeronautics and Astronautics
These results show that the vapor has a preferential path through the condensers located nearer the center of the<br />
evaporator. The vapor flow seems to search for the shorter way through the condenser. The forced convection tests<br />
(A and B) showed that for intense convective heat transfer external to the condensers, the system is overdimensioned.<br />
Only a small portion of the condensers is necessary to transfer the heat power input. The remaining<br />
portion did not even start-up.<br />
temperature [°C]<br />
90<br />
80<br />
70<br />
60<br />
50<br />
40<br />
30<br />
T21<br />
T16<br />
Evaporator<br />
T26<br />
T11<br />
condenser + cooling fluid<br />
20<br />
0 50 100 150<br />
time [min]<br />
Figure 5. Temperatures as a function of time for test B<br />
Natural Convection Tests<br />
The effect of cooling by natural convection on the tree configuration thermosyphon was analyzed in tests C,<br />
D and E (see Table 2). Natural convection, especially with air as the cooling fluid, yields much less effective heat<br />
transfer. In test C, the heater power input was 80 W and the test lasted for a long time (almost 7 hours) in order to<br />
observe both the transient and steady state behaviors of the thermosyphon. In test D, the power input was 500 W, but<br />
the time of testing was much smaller, approximately 25 min. The thermal behavior of the thermosyphon when the<br />
heat power is turn off was also analyzed in this case. Finally, in test E, the power input was 150 W while stagnant<br />
water was confined externally to the condensers in order to obtain natural convection cooling.<br />
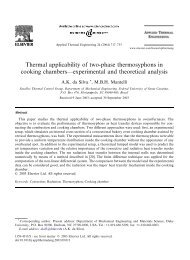
The evaporator temperatures as a function of time for test C are shown in Fig. 6. The graph shows that after<br />
approximately 150 min of test the temperatures reached steady state. The four parallel condensers present very<br />
similar behavior, indicating that the vapor is distributed evenly among the four condensers in this case, contrary to<br />
the forced convection tests presented previously. There are four important groups of curves in this graph. The first<br />
group correspond to the bottom half of the condensers and the evaporator, which are within 10°C of difference<br />
among them and is located in upper region of the graph (mean temperature of 85°C). The evaporator and the bottom<br />
half of the condensers are approximately isothermal. As for the group formed by T13, T18, T23 and T28 (mean<br />
temperature of 50°), and the group formed by T14, T19, T24 and T29 (mean temperature of 38°), which are located<br />
in the upper half of the condensers, the temperature levels are lower than the bottom half of the evaporator,<br />
especially for the tip of the condensers (T14, T19, T24 and T29), which are at a temperature only slightly higher<br />
than the cooling fluid (stagnant air). As the temperature of the condensers is higher than the cooling fluid in their<br />
entire length, one conclude that the entire length of the condensers are active, i.e., are exchanging heat with the<br />
external environment. However, the upper half of the condensers are not as effective as the bottom half, i.e, the<br />
upper half of the condensers are not fully started-up yet.<br />
The results of test D are very similar to test C, except that only T14, T19, T24 and T29 are cooler than the rest<br />
of the condenser. The power input in test D was much larger (500W) than in test C (80W) so the vapor had strength<br />
to advance further up into the condensers. Only the tips of the condensers were not fully started-up. As for test E<br />
(150W, water as cooling fluid) the results are also similar to test C: only the bottom of the condenser fully startedup,<br />
while the remaining parts are ineffective for heat transfer.<br />
8<br />
American Institute of Aeronautics and Astronautics
90<br />
T6, T7, T8, T9<br />
80<br />
70<br />
T12, T17, T22, T27<br />
temperature [°C]<br />
60<br />
50<br />
40<br />
T10, T15, T20, T25<br />
T11, T16, T21, T26<br />
T13, T18, T23, T28<br />
T14, T19, T24, T29<br />
30<br />
cooling fluid (stagnant air)<br />
20<br />
0 50 100 150 200 250 300 350 400<br />
time [min]<br />
Figure 6. Temperatures as a function of time for test C<br />
Thermal resistances<br />
Several theoretical models and empirical correlations are available in the literature to estimate the vapor<br />
condensation resistance inside the condenser tube. Faghri 1 and Mantelli et al. 2 review some of these expressions and<br />
the results show differences of one order of magnitude in the predicted condensation heat transfer coefficient h c<br />
appearing in Eq. (8). I this work, Re f (defined by Eq. 6) ranges from 0.8 to 16. According to Faghri 1 , the falling<br />
liquid film is laminar for Re f < 30. Nusselt developed a theoretical model for laminar film flow and Faghri 1 presents<br />
a correlation for this model (Eq. 4). Kaminaga et al. 5 proposed a correlation from experimental data covering Re f in<br />
both the laminar and the turbulent ranges (Eq. 7). Figure 7 shows a comparison between the correlation of Kaminaga<br />
et al. 5 (Eq. 7) and the correlation from Nusselt’s model (Eq. 4) for a mean temperature of approximately 50°C. As<br />
one can see, Nusselt’s model yields conductance values one order of magnitude larger than Kaminaga’s correlation.<br />
Mantelli et al. 2 compared these two correlations along with many other correlations available in the literature against<br />
experimental data collected from a conventional two-phase thermosyphon made similarly to the condensers used in<br />
this work. Kaminaga’s correlation showed the best agreeement with the experimental data. Also, Kaminaga’s<br />
correlation yielded the smallest values of condensation conductance from all models tested that can be applied to<br />
laminar flow, while Nusselt’s model yields the largest values of h c . Appart from the large difference between the<br />
absolute values of the two models, they also present different behaviours with increasing power input: Nusselt’s<br />
model decrease with the heat transfer rate while Kaminaga’s correlation shows an increse of h c with the heat transfer<br />
rate. In this work, Kaminaga’s correlation is used in order to predict h c due to reasons to be explained later.<br />
Apart from the dependence on the heat transfer rate, the correlation of Kaminaga et al. 5 is also dependent on the<br />
mean temperature level. Figure 8 illustrates the dependence of the condensation resistance on both the mean<br />
temperature level and on the heat power input in the ranges of interest in this work. As one can see, the influence of<br />
the temperature is much smaller than the influence of the heat power input and can be neglected.<br />
As already mentioned, the objective of this work is to analyze the condensation process inside the parallel<br />
condensers. The condenser resistance is defined according to Eq. (10), i.e.:<br />
R<br />
c<br />
Tv<br />
− Tc<br />
R 6 + R<br />
= = 7<br />
(11)<br />
q 4<br />
9<br />
American Institute of Aeronautics and Astronautics
hc [W/m²K]<br />
100000<br />
10000<br />
Kaminaga<br />
Nusselt<br />
1000<br />
0 0,2 0,4 0,6 0,8 1<br />
power input [kW]<br />
Figure 7. Comparison between the correlations of Kaminaga and Nusselt for film condensation<br />
7,E-03<br />
6,E-03<br />
5,E-03<br />
R6 [°C/W]<br />
4,E-03<br />
3,E-03<br />
2,E-03<br />
1,E-03<br />
0,E+00<br />
40 45 50 55 60<br />
Temperature [°C]<br />
q=50W<br />
q=500W<br />
q=1000W<br />
Figure 8. Effects of temperature and heat transfer rate on the condenser resistance<br />
The vapor temperature T v is measured using thermocouple 6, which is placed inside a needle inserted in the<br />
evaporator (see Fig. 4.b). The condenser mean temperature T c is given by the average of the temperature readings<br />
of the active length of the condenser. For the natural convection tests (C, D, E), the entire length of the condenser is<br />
active and therefore:<br />
⎛T11+<br />
T12<br />
+ T13+<br />
T14<br />
+ T16<br />
+ T17<br />
+ T18<br />
+ T19<br />
+ ⎞<br />
T c =<br />
⎜<br />
/16<br />
21 22 23 24 26 27 28 29<br />
⎟<br />
(12)<br />
⎝T<br />
+ T + T + T + T + T + T + T ⎠<br />
On the other hand, for the forced convection tests (A and B), only a small portion of the condensers is active. As<br />
discussed previously, T11, T16, T21 and T26 are the only thermocouples readings above the cooling fluid<br />
temperature. The other condenser thermocouples are at the same temperature as the cooling water, indicating that<br />
these portions of the condenser are inactive. Therefore, for the forced convection tests the active condenser<br />
temperature is given by:<br />
T c = ( T11+<br />
T16<br />
+ T 21+<br />
T 26) / 4<br />
(13)<br />
Figure 9 shows a comparison between the measured and the predicted values of the condenser resistance for the<br />
forced convection tests (A and B). The experimental data was reduced using Eqs. (11) and (13), while the theoretical<br />
10<br />
American Institute of Aeronautics and Astronautics
prediction was obtained using Eqs. (3), (6), (7), (8) and (10). The condenser length l c appearing in Eqs. (3) and (8) is<br />
0.165 m, which is assumed to be approximately the active length of the condensers. This value was obtained from<br />
the observation that only thermocouples T11, T16, T21 and T26 detected the presence of vapor, as mentioned<br />
previously. As one can see, the data presents larger condenser resistances than the predictions. For small power<br />
input the differences are up to one order of magnitude, while for the highest power input tested (1000 W), the<br />
experimental value is approximately twice the predicted value of condenser resistance. As resistance R 7 is fairly well<br />
known because it is due to the radial conduction through the tube wall (Eq. 3), one can conclude that the differences<br />
between the predicted and the measured values of the condenser resistance is due to the condensation resistance R 6<br />
(Eq. 11). As already mentioned, Kaminaga’s correlation yields the smallest value of condensation resistance from<br />
the models available in the literature. Yet, the measured resistances are still larger than the predicted values.<br />
Therefore, similarly to presented by Mantelli et al. 2 , Kaminaga’s correlation gives the best agreement with the<br />
experimental data, despite being of up to one order of magnitude smaller than the data.<br />
Rc [°C/W]<br />
1<br />
0,1<br />
0,01<br />
data (test A)<br />
data (test B)<br />
theory<br />
0,001<br />
0 200 400 600 800 1000<br />
Pow er input [W]<br />
Figure 9. Theoretical and experimental values of condenser resistance<br />
for the forced convection tests<br />
The comparison between the measured and the predicted values of the condenser resistance for the free<br />
convection tests (C, D and E) is shown in Figure 10. The experimental data was reduced using Eqs. (11) and (12),<br />
while the theoretical prediction was obtained using Eqs. (3), (6), (7), (8) and (10). The condenser length l c appearing<br />
in Eqs. (3) and (8) is 0.594 m, which is the total length of the condensers. Similarly to the forced convection tests,<br />
the data presents larger condenser resistances than the predictions. For the smallest power input tested (test C, 80W)<br />
the difference is almost two orders of magnitude, while for the highest power input tested (test E, 500W), the<br />
experimental value is approximately one order of magnitude larger than the predicted value of condenser resistance.<br />
Again, it is expected that the differences are primarily due to the condensation resistance, which is being<br />
underpredicted by the model.<br />
The results presented in Figures 9 and 10 would suggest that the performance of the parallel condensers is not as<br />
good as four independent regular thermosyphons were used. The modeling employed in this work showed to be<br />
adequate in predicting regular thermosyphons (Mantelli et al. 2 ). Yet, for the tree configuration thermosyphon the<br />
experimental data indicate larger thermal resistances than the model. One cause for this behavior could be the size of<br />
the system, which appears to be over-dimensioned. In both Figs. 9 and 10 one can be observe that the agreement<br />
between theory and data tend to be better as the power input increases. Kaminaga’s correlation predicts correctly the<br />
trend observed in the experimental data: the condenser resistance decreases with increasing heat transfer rate. For<br />
heat transfer rates larger than tested here, the results suggest that the modeling would predict the data better. For the<br />
application under consideration, which is domestic ovens, the power input is in the range of 300 to 1500W, the<br />
results show that the dimensions could be smaller and the results would be better.<br />
Apart from the fact that the measured thermal resistance is larger than expected, the absolute value is still small.<br />
It is in the order of 10 -2 °C/W, which means that for a power input in the order of 10 3 W the temperature drop of the<br />
condenser is approximately 10°C. Furthermore, the single evaporator showed to be very effective in distributing the<br />
11<br />
American Institute of Aeronautics and Astronautics
vapor equally among all the four condensers, especially when the external heat transfer coefficient is small (natural<br />
convection). This result is especially interesting when considering the fact that in the primary application of the tree<br />
configuration thermosyphon, i. e., bakery ovens, the condenser is subjected to small heat transfer coefficients<br />
(natural convection).<br />
Rc [°C/W]<br />
1<br />
0,1<br />
0,01<br />
theory<br />
data (test C)<br />
data (test D)<br />
data (test E)<br />
0,001<br />
0 100 200 300 400 500 600<br />
Power input [W]<br />
Figure 10. Theoretical and experimental values of condenser resistance<br />
for the natural convection tests<br />
V. Summary and Conclusions<br />
This work presents a study on the tree configuration thermosyphon, which is composed by four parallel<br />
condensers and a single evaporator. The objective of the work is to analyze the applicability of the thermosyphon of<br />
to systems where one is interested in homogenizing the temperature inside enclosures. One particular application of<br />
interest is domestic and industrial ovens. A prototype of the tree configuration thermosyphon was built and tested<br />
under both natural and forced convection cooling over the condenser. The results show that for the natural<br />
convection tests, the evaporator can easily spread the vapor evenly through all the condensers, homogenizing the<br />
condensers temperatures. This homogenization is not expected with several conventional thermosyphons in parallel.<br />
The same was not observed for the forced convection tests, where due to the high heat transfer coefficient, not the<br />
entire condenser is necessary to dissipate the power input. As a consequence the vapor tends to concentrate in a<br />
small portion of the condenser. The external conditions are important for the evaluation of the heat transfer<br />
characteristics of the thermosyphon. This means that it is impossible to obtain a thermosyphon thermal resistance,<br />
only related to the heat transfer phenomenon that happens inside the thermosyphon. Actually, the models should<br />
include the external heat transfer conditions.<br />
The measured condenser resistance was compared with models and correlations available in the literature. The<br />
results show that the overall thermal resistance of the condensers is larger than predicted by the modeling employed.<br />
However, the larger the power input, the smaller the differences between the model and experiments. The results<br />
suggest that the thermosyphon is over-dimensioned for the heat transfer levels encountered in domestic ovens,<br />
primary objective for the development of the tree configuration thermosyphon. Despite the differences, the absolute<br />
value of the thermosyphon overall thermal resistance is actually very low, which demonstrates the device can be<br />
applied to isothermalize ovens and furnaces where natural convection of air is responsible for removing the heat<br />
being transferred by the thermosyphon.<br />
Acknowledgments<br />
The authors would like to acknowledge the support of CENPES-PETROBRÁS during this project.<br />
12<br />
American Institute of Aeronautics and Astronautics
References<br />
1 Faghri, A., Heat Pipe Science and Technology, Taylor & Francis, Bristol, 1995.<br />
2 Mantelli, M. B. H., Colle, S., de Carvalho, R. D. M. & de Moraes, D. U. C., “<strong>Study</strong> of closed two-phase thermosyphons for<br />
bakery oven applications,” Proceedings of the 33rd National Heat Transfer Conference, Albuquerque, NM, 1999, pp. 1, 8.<br />
3 Incropera, F. P. and de Witt, D. P., Fundamentos de Transferência de Calor e de Massa, Ed. Guanabara Koogan, Rio de<br />
Janeiro, Brazil, 1992.<br />
4 Bejan, A., Convection Heat Transfer, John Wiley & Sons, Inc., New York, USA, 1995.<br />
5 Kaminaga, F., Hashimoto, H., Feroz M. D., Goto, K. and Matsumura, K., “Heat Transfer Characteristics of Evaporation and<br />
Condensation in a Two-Phase Closed <strong>Thermosyphon</strong>,” Proceedings of the 8th International Heat Pipe Conference, Beijing,<br />
China, 1992.<br />
6 Brost, O., Closed Two-Phase <strong>Thermosyphon</strong>s, Class Notes, IKE, University of Stuttgart, Germany, 1996.<br />
13<br />
American Institute of Aeronautics and Astronautics