Solar energy scenarios in Brazil, Part one: Resource ... - LEPTEN
Solar energy scenarios in Brazil, Part one: Resource ... - LEPTEN
Solar energy scenarios in Brazil, Part one: Resource ... - LEPTEN

You also want an ePaper? Increase the reach of your titles
YUMPU automatically turns print PDFs into web optimized ePapers that Google loves.
ARTICLE IN PRESSEnergy Policy 36 (2008) 2843– 2854Contents lists available at ScienceDirectEnergy Policyjournal homepage: www.elsevier.com/locate/enpol<strong>Solar</strong> <strong>energy</strong> <strong>scenarios</strong> <strong>in</strong> <strong>Brazil</strong>, <strong>Part</strong> <strong>one</strong>: <strong>Resource</strong> assessmentF.R. Mart<strong>in</strong>s a, , E.B. Pereira a , S.A.B. Silva a , S.L. Abreu b , Sergio Colle ca Centre for Weather Forecast and Climate Studies, <strong>Brazil</strong>ian Institute for Space Research, CPTEC-INPE, P.O. Box 515, São José dos Campos, SP 12245-970, <strong>Brazil</strong>b Centro Federal de Educac-ão Tecnológica de Santa Catar<strong>in</strong>a—CEFET-SC, Rua José L<strong>in</strong>o Kretzer 608, São José, SC 88103-310, <strong>Brazil</strong>c <strong>Solar</strong> Energy Laboratory, University of Santa Catar<strong>in</strong>a—LABSOLAR-UFSC, Campus Universitário Tr<strong>in</strong>dade, Florianópolis 88040-900, <strong>Brazil</strong>article <strong>in</strong>foArticle history:Received 1 November 2007Accepted 18 February 2008Available onl<strong>in</strong>e 18 April 2008Keywords:<strong>Solar</strong> resource maps<strong>Brazil</strong>SWERAabstractThe ‘‘<strong>Solar</strong> and W<strong>in</strong>d Energy <strong>Resource</strong> Assessment’’ (SWERA) project was an <strong>in</strong>ternational projectf<strong>in</strong>anced by GEF/UNEP, which aimed at provid<strong>in</strong>g a consistent and accessible database to foster the<strong>in</strong>sertion of renewable energies on the <strong>energy</strong> matrix of develop<strong>in</strong>g countries. This paper presents thesolar <strong>energy</strong> resource assessment generated dur<strong>in</strong>g the SWERA project by us<strong>in</strong>g the radiative transfermodel BRASIL-SR fed with satellite and climate data. The solar irradiation estimates were validated bycompar<strong>in</strong>g with the ground data acquired <strong>in</strong> several sites spread out the <strong>Brazil</strong>ian territory. Maps on10 10 km 2 spatial resolution were generated for global, diffuse and direct normal solar irradiation.<strong>Solar</strong> irradiation on a plane tilted by an angle equal to the local latitude was also generated at the samespatial resolution. Besides the solar resource maps, the annual and seasonal variability of solar <strong>energy</strong>resource was evaluated and discussed. By analyz<strong>in</strong>g the <strong>Brazil</strong>ian solar resource and variability maps,the great potential available for solar <strong>energy</strong> applications <strong>in</strong> <strong>Brazil</strong> is apparent, even <strong>in</strong> the semitemperateclimate <strong>in</strong> the southern region where the annual mean of solar irradiation is comparable tothat estimated for the equatorial Amazonian region.& 2008 Elsevier Ltd. All rights reserved.1. IntroductionEnergy is essential for the social development and economicgrowth of any nation. The human quality of life is strongly relatedto the per capita consumption of <strong>energy</strong>, which has been ris<strong>in</strong>gsteadily for the last few decades <strong>in</strong> the develop<strong>in</strong>g countries as aconsequence of the growth <strong>in</strong> agricultural and <strong>in</strong>dustrial activities,the improvement of social conditions and the <strong>in</strong>troduction of newtechnologies. The net result of this has been that the <strong>energy</strong>demand has multiplied manifold and it can be no longer satisfiedby the traditional <strong>in</strong>efficient <strong>energy</strong> technology (Goldemberg andVillanueva, 2003).In addition to that, the l<strong>in</strong>k between current <strong>energy</strong> consumptionand environmental damage has been demonstrated. The lastIPCC report (IPCC, 2007) re<strong>in</strong>forces that fossil fuel <strong>energy</strong>consumption is the major contributor for global warm<strong>in</strong>g due togreenhouse gas emissions. Other studies stated that alternative<strong>energy</strong> sources should be implemented over the next 20 years <strong>in</strong>order to help reduce greenhouse gas emissions and to enhance the<strong>energy</strong> security (Sims, 2004).However, mid- and long-term <strong>energy</strong> plann<strong>in</strong>g requiresreliable <strong>in</strong>formation on many natural resources focus<strong>in</strong>g on the Correspond<strong>in</strong>g author. Tel.: +5512 3945 6778; fax: +5512 3945 6810.E-mail address: fernando@dge.<strong>in</strong>pe.br (F.R. Mart<strong>in</strong>s).renewable <strong>energy</strong> policy. Usually, <strong>in</strong>vestors, risk capital enterprisesand <strong>in</strong>dependent <strong>energy</strong> producers are not aware of theavailable renewable <strong>energy</strong> options and tend to avoid the risk ofactivities deal<strong>in</strong>g with renewable <strong>energy</strong> projects <strong>in</strong> develop<strong>in</strong>gcountries where reliable and suitably detailed data are almostnon-existent. In summary, the ma<strong>in</strong> knowledge obstacle toenhance <strong>in</strong>vestments <strong>in</strong> renewable <strong>energy</strong> production <strong>in</strong> develop<strong>in</strong>gcountries is related to the lack of a reliable renewable<strong>energy</strong> resource assessment. The resource assessment datatogether with <strong>in</strong>formation on the resource variability andconfidence levels l<strong>in</strong>ked to several natural and non-naturalvariables (such as climate, topography and man-made impacts<strong>in</strong> environment) are essential to develop projects <strong>in</strong> renewable<strong>energy</strong> usage.The United Nations Environment Programme (UNEP) andGlobal Environmental Facility (GEF) gave support to a scientificprogram <strong>in</strong> order to build up a reliable database <strong>in</strong> solar and w<strong>in</strong>d<strong>energy</strong> resource. The ‘‘<strong>Solar</strong> and W<strong>in</strong>d <strong>Resource</strong> Assessment’’(SWERA) project aims at foster<strong>in</strong>g the <strong>in</strong>sertion of renewableenergies <strong>in</strong> the <strong>energy</strong> matrix of develop<strong>in</strong>g countries. The SWERAproject is assembl<strong>in</strong>g high-quality <strong>in</strong>formation on solar and w<strong>in</strong>d<strong>energy</strong> resources <strong>in</strong>to consistent geographic <strong>in</strong>formation system(GIS) analysis tools for develop<strong>in</strong>g countries divided <strong>in</strong>to threegreat regional groups: Africa, Lat<strong>in</strong> America and Asia. The projectis ma<strong>in</strong>ly <strong>in</strong>tended for the government and private sectors<strong>in</strong>volved <strong>in</strong> the development of the <strong>energy</strong> market and it shall0301-4215/$ - see front matter & 2008 Elsevier Ltd. All rights reserved.doi:10.1016/j.enpol.2008.02.014
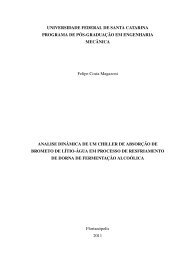
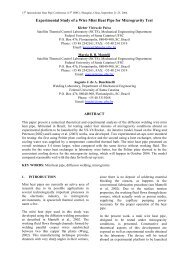
ARTICLE IN PRESSF.R. Mart<strong>in</strong>s et al. / Energy Policy 36 (2008) 2843–2854 2845Fig. 1. Flowchart of radiative transfer model BRASIL-SR.radiation spectral <strong>in</strong>terval (0–4 mm) is split <strong>in</strong>to 135 sub<strong>in</strong>tervals.The thickness of each atmospheric layer as well as the verticalprofiles of temperature and atmospheric gas concentrations areestablished for the standard atmosphere selected as a function ofthe air temperature at the surface. The model employs thecont<strong>in</strong>ental profile of atmospheric aerosols for altitudes from 0 to50 km, corrected for the first 5 km through climatologic visibilityvalues (Pereira et al., 2006).The terra<strong>in</strong> topography was obta<strong>in</strong>ed from the GTOPO30database made available by the US Geological Survey (http://edc.usgs.gov/products/elevation/gtopo30html/). This database is<strong>in</strong> a grid format with a horizontal resolution of 30 arcsec(approximately 1 km) and topographic precision up to 100 m,which is more than adequate for solar radiation model<strong>in</strong>g. Fig. 2shows the elevation map for the <strong>Brazil</strong>ian territory.The global solar irradiation at the surface <strong>in</strong> any sky conditionis obta<strong>in</strong>ed from a l<strong>in</strong>ear relation between the solar radiationflux at the surface <strong>in</strong> clear and overcast sky conditions. The cloudcover <strong>in</strong>dex (CCI) is the weight<strong>in</strong>g factor between those extremeconditions and the confidence and reliability of the CCI is achief factor to obta<strong>in</strong> solar estimates with good accuracy (Mart<strong>in</strong>set al., 2007). The CCI conta<strong>in</strong>s <strong>in</strong>formation on spatial distributionand optical thickness of clouds and it was obta<strong>in</strong>ed byus<strong>in</strong>g Eq. (1) for each pixel from GOES images. The L stands forthe visible radiance measured by the satellite sensor, and L clrand L cld are, respectively, the visible radiances measured <strong>in</strong> thesame wavelength spectral range at clear and overcast skyFig. 2. Topography map for <strong>Brazil</strong>ian territory <strong>in</strong>clud<strong>in</strong>g the borders of <strong>Brazil</strong>iangeographical regions.
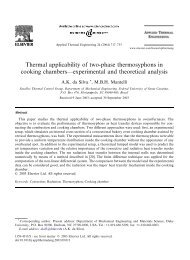
ARTICLE IN PRESS2846F.R. Mart<strong>in</strong>s et al. / Energy Policy 36 (2008) 2843–2854conditions.CCI ¼ ½L L clrŠ(1)½L cld L clr ŠThe L clr and L cld values for each image pixel are obta<strong>in</strong>ed bystatistical analysis of satellite images (Mart<strong>in</strong>s et al., 2007). Thekey po<strong>in</strong>t <strong>in</strong> this methodology is its <strong>in</strong>dependence from thecalibration factors and electronic degradation of satellite sensors.It was assumed that CCI equal to 1.0 denotes overcast sky withaltostratus (As) clouds. Previous studies showed that As clouds arethe most common cloud type <strong>in</strong> cont<strong>in</strong>ental areas <strong>in</strong> the latituderange where <strong>Brazil</strong> is located (Warren et al., 1986).It was assumed that the entire cloud coverage is formed by as<strong>in</strong>gle type of cloud with its base at 500 mb and uniformly distributed<strong>in</strong> two atmospheric layers <strong>in</strong> order to solve the solar radiative transferequation for the overcast sky condition. The Stephens parameterizationwas assumed to determ<strong>in</strong>e the total ext<strong>in</strong>ction coefficient and thetotal liquid water content of the cloud (Stephens, 1978).The diffuse solar radiation is determ<strong>in</strong>ed by subtract<strong>in</strong>g thedirect comp<strong>one</strong>nt from the global solar radiation at the horizontalsurface. The normal direct irradiation (DNI) is estimated assum<strong>in</strong>gthat the absorption by clouds is not significant and that thecontribution of scatter<strong>in</strong>g of the solar radiation by clouds may beadded to the atmospheric transmittance <strong>in</strong> clear sky conditions.The solar irradiation on a tilted plane was obta<strong>in</strong>ed by us<strong>in</strong>g thePerez et al. (1987) methodology.The reliability of the solar irradiation estimates provided bymodel BRASIL-SR was evaluated <strong>in</strong> two tasks: (i) throughcomparison with estimates provided by the core radiation transfermodels adopted by the SWERA to map the solar <strong>energy</strong> <strong>in</strong> othercountries tak<strong>in</strong>g part <strong>in</strong> the project and (ii) through thecomparison among the estimates with solar radiation fluxmeasured at the surface (ground truth). The results obta<strong>in</strong>ed <strong>in</strong>the first task demonstrated that BRASIL-SR presents a similarperformance as any other radiative transfer model adopted <strong>in</strong>SWERA (Beyer et al., 2004; Mart<strong>in</strong>s, 2003).In the second task, the solar flux estimates provided by theBRASIL-SR were compared with measured values acquired atseveral ground sites spread along the <strong>Brazil</strong>ian territory—ProjectSONDA (Mart<strong>in</strong>s et al., 2005) and AWS (Automated WeatherStations) operated by CPTEC/INPE (www.cptec.<strong>in</strong>pe.br/aws). Themodel BRASIL-SR achieved a similar performance <strong>in</strong> all geographicregions of the country with a slight overestimation of the globalsolar flux—mean bias error (MBE) roughly 6%. The root meansquare error (RMSE) was about 13% throughout the <strong>Brazil</strong>ianterritory. Table 1 presents a summary for mean deviationobserved <strong>in</strong> solar radiation estimates provided by BRASIL-SR.The larger deviations were observed <strong>in</strong> the Amazon region, whichpresents larger precipitation all through the year and the groundstations ma<strong>in</strong>tenance was more complex reduc<strong>in</strong>g the confidenceof ground data (Pereira et al., 2006).The direct beam solar irradiation (DNI) values provided byBRASIL-SR overestimated the ground data and presented largerTable 1Summary of the deviations presented by global solar estimates provided byBRASIL-SR <strong>in</strong> each <strong>Brazil</strong>ian geographic regionGeographical region MBE (Wh/m 2 ) MBE (%) RMSE (%) Correlation factorNorthern 353.48 7 15 0.85Northeastern 306.75 6 13 0.97Midwestern 272.11 5 13 0.89Southeastern 249.10 5 14 0.93Southern 259.49 5 12 0.97The last column presents the correlation factor among ground data and modelestimates.Table 2Deviations presented by DNI estimates provided by BRASIL-SR when comparedwith the ground data acquired <strong>in</strong> SONDA networkGround site MBE (Wh/m 2 ) MBE (%) RMSE (%) Correlation factorSão Mart<strong>in</strong>ho da Serra 872.8 13.0 19.7 0.96Florianópolis 1147.5 22.7 29.2 0.95Petrol<strong>in</strong>a 718.4 12.7 18.3 0.96All sites 903.2 15.1 21.6 0.95The last column presents the correlation factor among ground data and modelestimates.deviations (MBE E15% and RMSE E22%). The simple parameterizationused to model the cloud transmittance of the direct beamis responsible for the overestimation of direct beam irradiation,ma<strong>in</strong>ly <strong>in</strong> the overcast days (Pereira et al., 2006). Unfortunately,only few ground sites collect direct solar beam radiation <strong>in</strong> <strong>Brazil</strong>with the high quality required to be used <strong>in</strong> model validation.Table 2 presents the estimate deviations for all the ground sitesavailable for DNI validation.3.2. Global solar irradiationFig. 3 presents annual and seasonal averages of daily globalsolar irradiation <strong>in</strong> <strong>Brazil</strong>. In spite of the different climate andenvironmental characteristics of the <strong>Brazil</strong>ian territory, <strong>one</strong> canobserve that the global irradiation is fairly uniform. The maximumvalue—more than 6.5 kWh/m 2 day—occurs <strong>in</strong> the semi-arid areaof the <strong>Brazil</strong>ian Northeastern region (around 101S/431W). Thisarea presents a semi-arid climate with low annual precipitation(around 300 mm) and the lowest mean cloud cover of <strong>Brazil</strong>(INMET, 2007) due to the <strong>in</strong>fluence of the tropical high pressureassociated with the South Atlantic tropical anticycl<strong>one</strong>.The m<strong>in</strong>imum value, around 4.25 kWh/m 2 day, was obta<strong>in</strong>edfor the coastal area of the Southern region of <strong>Brazil</strong>, which ischaracterized by a relatively large precipitation. The temperateclimate and the <strong>in</strong>fluence of the cold systems associated with theAntarctic Polar anticycl<strong>one</strong> contribute to enhance the nebulosity<strong>in</strong> the region, ma<strong>in</strong>ly <strong>in</strong> w<strong>in</strong>ter months. Fig. 4 shows theclimatology of annual precipitation and cloud cover for the<strong>Brazil</strong>ian territory tak<strong>in</strong>g <strong>in</strong>to consideration ground data collectedfrom 1931 till 1990.The annual sum of daily horizontal global solar irradiation <strong>in</strong>any <strong>Brazil</strong>ian region (1500–2500 kWh/m 2 ) is greater than thosefor the majority of the European countries such as Germany(900–1250 kWh/m 2 ), France (900–1650 kWh/m 2 ) and Spa<strong>in</strong>(1200–1850 kWh/m 2 ) where projects to harness solar resourcesare greatly dissem<strong>in</strong>ated, some with huge government <strong>in</strong>centives(European Database for Daylight and <strong>Solar</strong> Radiation, 2007).It is worthy of note that the Southern region is subjected tolarger mean irradiances than the Northern region dur<strong>in</strong>g thesummer season notwithstand<strong>in</strong>g the latter be<strong>in</strong>g much closer tothe equator. This is expla<strong>in</strong>ed by climate characteristics of Amazonregion with large precipitation and persistent cloud cover dur<strong>in</strong>gthe summer months ow<strong>in</strong>g to the strong <strong>in</strong>fluence of theIntertropical Convergence Z<strong>one</strong> (ITCZ). The North and Centralregions of <strong>Brazil</strong> receive the largest solar irradiances particularlydur<strong>in</strong>g the dry season from July till September, when precipitationis low, and clear sky days predom<strong>in</strong>ate.Fig. 5 shows the annual and seasonal variability of daily sumsof global solar irradiation. The annual variability, V annual , wasdef<strong>in</strong>ed here as the average of the <strong>in</strong>tra-annual variabilityobserved for each day of the year. The <strong>in</strong>tra-annual variability,V d,y , for the day d of the year y is def<strong>in</strong>ed as presented <strong>in</strong> Eq. (2).SD d stands for the mean quadratic deviation of global solar
ARTICLE IN PRESSF.R. Mart<strong>in</strong>s et al. / Energy Policy 36 (2008) 2843–2854 2847Fig. 3. (a) Annual average of daily sum of the global solar irradiation <strong>in</strong> <strong>Brazil</strong>ian territory. (b) Seasonal averages of daily sum of the global solar irradiation <strong>in</strong> <strong>Brazil</strong>ianterritory. The summer season comprises the period from December till February. The period between March and May is related to the fall season. The w<strong>in</strong>ter encompassJune to August, and the spr<strong>in</strong>g season starts at September and ends at November.
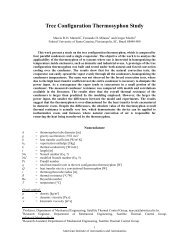
ARTICLE IN PRESS2848F.R. Mart<strong>in</strong>s et al. / Energy Policy 36 (2008) 2843–2854Fig. 4. Maps for annual precipitation and nebulosity <strong>in</strong> the <strong>Brazil</strong>ian territory based <strong>in</strong> ground data collected <strong>in</strong> a 60-year period (1931–1990). Source: <strong>Brazil</strong>ian Institute forMeteorology (INMET, 2007).irradiation for day d of year y from its annual mean <strong>in</strong> the sameyear. I d stands for the mean daily solar flux for the same day d <strong>in</strong>the time period from 1995 to 2005. V d,y can be understood as themean value of the ratio between SD d and I d .V annual ¼ V d;yN dwhere¼P 365d¼1 SD d=I dN dsPffiffiffiffiffiffiffiffiffiffiffiffiffiffiffiffiffiffiffiffiffiffiffiffiffiffiffiffiffiffiffiffiffiffiffiffiffiffiffi2005y¼1995SD d ¼ðI d;y I y Þ 2and I d ¼N yP 2005y¼1995 I d;yNyThe seasonal variability, V seasonal , was def<strong>in</strong>ed as the mean <strong>in</strong>traseasonalvariability, V sea,y , observed for each year <strong>in</strong> the1995–2005 period. The <strong>in</strong>tra-seasonal variability, V sea,y for aspecific year was determ<strong>in</strong>ed through the ratio between themean quadratic deviation, SD sea,y , and the mean value of the dailysolar flux for a specific season, I sea,y , as presented <strong>in</strong> Eq. (3):P 2005y¼1995V seasonal ¼V sea;yN ywhereV sea;y ¼ SD sea;yI sea;ysPffiffiffiffiffiffiffiffiffiffiffiffiffiffiffiffiffiffiffiffiffiffiffiffiffiffiffiffiffiffiffiffiffiffiffiffiffiffiffiffiff<strong>in</strong>2d¼n1SD sea;y ¼ðI d;y I sea;y Þ 2P n2d¼n1and I sea;y ¼I d;sea(3)N d;seaN d;seaAnalyz<strong>in</strong>g the annual variability map, <strong>one</strong> may notice that theentire Amazon and the Central regions <strong>in</strong>clud<strong>in</strong>g the westernportion of the Northeastern region show lower variabilitythroughout the year—less than 25%. These regions show dist<strong>in</strong>ctiveclimate characteristics that reduce the solar flux variabilitythroughout the year as for example the low nebulosity allthrough the year <strong>in</strong> the semi-arid region and the high nebulositydur<strong>in</strong>g the summer <strong>in</strong> the Amazon region.It can be verified that the seasonal variability shows the samepattern observed for the annual variability. The entire Central–-North area of the country—the Amazon, the Cerrado area, thesemi-arid region <strong>in</strong> <strong>Brazil</strong>ian Northeast and the western part ofthe Southeast region—show the smallest seasonal variability. Thevariability is lower dur<strong>in</strong>g the w<strong>in</strong>ter (June through August) andlarger <strong>in</strong> the summer (from December till February). This behaviorreflects the nebulosity variation all through the year. Dur<strong>in</strong>g the(2)w<strong>in</strong>ter the ra<strong>in</strong> precipitation is low <strong>in</strong> this entire region and thenumber of days with clear skies is greater, thereby reduc<strong>in</strong>g thevariability of solar irradiation <strong>in</strong> the region. The presence of largenebulosity dur<strong>in</strong>g the summer expla<strong>in</strong>s the larger variability ofsolar irradiation with<strong>in</strong> this period.On the other hand, the Southern and coastal area of Southeasternregions presents higher annual variability, around 45%,due to the <strong>in</strong>cursions of cold fronts orig<strong>in</strong>at<strong>in</strong>g from the deepcyclonic systems <strong>in</strong> the Antarctic region, ma<strong>in</strong>ly <strong>in</strong> fall and w<strong>in</strong>terseasons. The coastal regions of the South and Southeast show thelargest variability dur<strong>in</strong>g all seasons of the year.Fig. 6 allows a comparison of the <strong>in</strong>ter-annual variability of theannual and seasonal averages of daily global solar irradiation foreach of the <strong>Brazil</strong>ian political regions. The central squaresrepresent the averages <strong>in</strong> the 10-year period, the outer largersquares represents the range for confidence level equal to 67%(<strong>one</strong> standard deviation) and the vertical bars show the limits forconfidence level of 95%.In the box plot presented <strong>in</strong> Fig. 6(a), it can be noted that theNortheast region presented the smallest <strong>in</strong>ter-annual variability(between 5.7 and 6.1 kWh/m 2 /day) followed by the North region(between 5.2 and 5.8 kWh/m 2 /day). Dur<strong>in</strong>g the 10-year periodanalyzed, the South region showed larger <strong>in</strong>ter-annual variabilitywith annual mean solar flux vary<strong>in</strong>g between 4.6 and 5.6 kWh/m 2 /day.From box plots presented <strong>in</strong> Fig. 6(b) to (e), <strong>one</strong> can observethat the Southern region also presents the largest seasonalvariability. It is worth not<strong>in</strong>g that the mean solar radiation flux<strong>in</strong> summer is about 65% larger than it is <strong>in</strong> w<strong>in</strong>ter <strong>in</strong> this region.The North region presented the lowest seasonal variability allthrough the year with the m<strong>in</strong>imum variability <strong>in</strong> the spr<strong>in</strong>g (from5.7 till 6.1 kWh/m 2 /day) and the maximum at the w<strong>in</strong>ter (from 4.8till 6.0 kWh/m 2 /day).The fall and w<strong>in</strong>ter seasons showed the largest <strong>in</strong>ter-annualvariability <strong>in</strong> all regions of <strong>Brazil</strong> (larger spread<strong>in</strong>g measured bythe distance between bars on the figure). The frontal systems aresupposed to be the ma<strong>in</strong> reason for this larger variability <strong>in</strong> theSouth and Southeastern regions. The <strong>in</strong>crease <strong>in</strong> nebulosityresult<strong>in</strong>g from the <strong>in</strong>cursion of frontal systems causes a noticeablereduction of solar irradiation dur<strong>in</strong>g several consecutive days. Thereason for the variability <strong>in</strong>crease observed dur<strong>in</strong>g the fall andw<strong>in</strong>ter seasons <strong>in</strong> the North and Midwest regions is not clear.A larger quantity of clear sky days can be observed (lessnebulosity) <strong>in</strong> these regions dur<strong>in</strong>g the dry season (fall and
ARTICLE IN PRESSF.R. Mart<strong>in</strong>s et al. / Energy Policy 36 (2008) 2843–2854 2849Fig. 5. Maps for annual and seasonal variability of daily totals of global irradiation <strong>in</strong> the 1995–2005 time <strong>in</strong>terval.
ARTICLE IN PRESS2850F.R. Mart<strong>in</strong>s et al. / Energy Policy 36 (2008) 2843–2854Fig. 6. Variability of annual and seasonal mean values of daily solar irradiation for each of the geographical regions of <strong>Brazil</strong>: (a) annual, (b) summer, (c) fall, (d) w<strong>in</strong>ter and(e) spr<strong>in</strong>g.
ARTICLE IN PRESSF.R. Mart<strong>in</strong>s et al. / Energy Policy 36 (2008) 2843–2854 2851Fig. 7. (a) Annual average of daily sum of the global irradiation on a plane tilted to an angle equals to local latitude. (b) Seasonal averages of daily sum of global irradiationthe latitude tilted plane. The seasons are arranged as described <strong>in</strong> Fig. 3.
ARTICLE IN PRESS2852F.R. Mart<strong>in</strong>s et al. / Energy Policy 36 (2008) 2843–2854Fig. 8. (a) Annual average of daily sum of the diffuse solar irradiation <strong>in</strong> <strong>Brazil</strong>ian territory. (b) Seasonal averages of daily sum of the diffuse irradiation <strong>in</strong> <strong>Brazil</strong>ian territory.The seasons are arranged as described <strong>in</strong> Fig. 3.
ARTICLE IN PRESSF.R. Mart<strong>in</strong>s et al. / Energy Policy 36 (2008) 2843–2854 2853w<strong>in</strong>ter). One hypothesis may be the <strong>in</strong>crease of aerosol particlenumber concentrations emitted to the atmosphere by the burn<strong>in</strong>gof biomass typical dur<strong>in</strong>g this time of the year <strong>in</strong> these regions.3.3. <strong>Solar</strong> irradiation over a tilted planFig. 7 presents the maps for annual and seasonal means ofglobal solar irradiation over a plan tilted to an angle equal to thecell latitude. The assessment of the ‘‘tilted’’ comp<strong>one</strong>nt is veryimportant <strong>in</strong>formation for the development of PV applications andsolar heat<strong>in</strong>g systems. Disregard<strong>in</strong>g the local topography, the solarirradiation over a surface tilted to a latitude angle is theconfiguration that allows captur<strong>in</strong>g the maximum solar <strong>energy</strong>throughout 1 year.All maps <strong>in</strong> Fig. 7 present similar patterns as discussed forglobal solar irradiation. The furthermost levels of irradiation onthe tilted plane occur <strong>in</strong> the range that goes from the Northeast tothe Southwest dur<strong>in</strong>g the spr<strong>in</strong>g and the smallest values <strong>in</strong> all<strong>Brazil</strong>ian regions occur dur<strong>in</strong>g the w<strong>in</strong>ter months.3.4. Diffuse solar irradiationFig. 8 exhibits the maps for annual and seasonal averages of thedaily total of diffuse solar irradiation. On the annual average <strong>one</strong>can observe that the Northern region receives greater diffuseirradiation ma<strong>in</strong>ly <strong>in</strong> the estuary of the Amazon River. This is dueto the larger nebulosity <strong>in</strong> the region as a result of the ITCZ<strong>in</strong>fluence. Seasonally the greatest diffuse irradiation occurs dur<strong>in</strong>gthe summer throughout the Amazon region. The smallest valueshappen dur<strong>in</strong>g the dry season (fall and w<strong>in</strong>ter) <strong>in</strong> the Southeasternand Southern regions.4. ConclusionsThis paper describes the satellite-derived assessment of solar<strong>energy</strong> resource prepared dur<strong>in</strong>g the SWERA project. The projectSWERA had f<strong>in</strong>ancial support from UNEP and GEF and it aimed atprovid<strong>in</strong>g reliable and high-quality <strong>in</strong>formation to decisionmakers, politicians, <strong>in</strong>vestors and stakeholders <strong>in</strong> order to fosterclean <strong>energy</strong> applications <strong>in</strong> develop<strong>in</strong>g countries. The solarirradiation maps for <strong>Brazil</strong> were prepared by us<strong>in</strong>g a radiativetransfer model BRASIL-SR fed by climate data and satellitederivedcloud cover data. The reliability of solar resourceestimates and model BRASIL-SR performance were checked outthrough comparisons with solar estimates provided by numericalmodels adopted <strong>in</strong> SWERA to map solar resources <strong>in</strong> otherparticipat<strong>in</strong>g countries and comparison with ground data acquired<strong>in</strong> all <strong>Brazil</strong>ian regions. Concisely, the model BRASIL-SRpresented a similar performance as other core models adopted bythe SWERA project for solar assessment <strong>in</strong> other regions, but itusually overestimates solar irradiation—MBE around 6% andRMSE about 13%.The larger values of global solar irradiation were found for thesemi-arid area <strong>in</strong> the <strong>Brazil</strong>ian Northeast region. The extremelydry environment (semi-desertic) and the high number of sunsh<strong>in</strong>ehours all year round resulted <strong>in</strong> mean solar irradiation around6.5 kWh/m 2 day. Slight smaller values were obta<strong>in</strong>ed for theSouthern region dur<strong>in</strong>g spr<strong>in</strong>g and summer seasons. However,the solar irradiation there presents higher variability through theyear due to the <strong>in</strong>cursions of cold fronts orig<strong>in</strong>at<strong>in</strong>g from the deepcyclonic systems <strong>in</strong> the Antarctic region, ma<strong>in</strong>ly dur<strong>in</strong>g fall andw<strong>in</strong>ter seasons.The maps for solar irradiation over a plane tilted <strong>in</strong> a angleequal to the local latitude po<strong>in</strong>t toward the great potentialavailable for solar <strong>energy</strong> applications <strong>in</strong> <strong>Brazil</strong>, even <strong>in</strong> the semitemperateclimate <strong>in</strong> the Southern region where annual mean ofsolar irradiation is comparable to that estimated for the equatorialAmazonian region. It was also verified that all <strong>Brazil</strong>ian territoriesreceive larger solar irradiance than many of the Europeancountries where a large number of solar <strong>energy</strong> projects are be<strong>in</strong>gimplemented ma<strong>in</strong>ly as a result of good <strong>energy</strong> regulation forrenewables and valuable government <strong>in</strong>centives.The <strong>scenarios</strong> for solar thermal and PV applications, preparedby us<strong>in</strong>g the GIS database acquired dur<strong>in</strong>g SWERA together withthe solar resource maps presented here, will be discussed <strong>in</strong> twoother papers to be published <strong>in</strong> the near future.AcknowledgmentsThis work was possible thanks to the f<strong>in</strong>ancial support ofUNEP/GEF (GFL-232827214364–SWERA) and FINEP(22.01.0569.00). This work was prepared with the fundamentalcontribution of the follow<strong>in</strong>g colleagues: Silvia V. Pereira, Crist<strong>in</strong>aYamashita, Sheila A.B. Silva, Hugo Corrá and Rafael Chagas. Thefollow<strong>in</strong>g <strong>in</strong>stitutional acknowledgment is due to Centre forWeather Forecast and Climatic Studies (CPTEC) and, <strong>in</strong> particular,for the people from the Environmental Satellite Division (CPTEC-DSA) for the cont<strong>in</strong>uous support <strong>in</strong> satellite data and ancillarysatellite products and from the Laboratory of MeteorologicalInstrumentation (CPTEC-LIM) for the support <strong>in</strong> operation andma<strong>in</strong>tenance of ground measurement sites. Thanks are due toDave Renné (NREL/USA), Richard Perez (SUNY/Albany) and TomHaml<strong>in</strong> (UNEP) for help and scientific contributions to thedevelopment of the SWERA project. Thanks are also due to CNPqfor the scholarships to researchers and technicians <strong>in</strong>volved <strong>in</strong> theSWERA tasks.ReferencesBeyer, H.G., Pereira, E.B., Mart<strong>in</strong>s, F.R., Abreu, S.L., Colle, S., Perez, R., Schill<strong>in</strong>gs, C.,Mannste<strong>in</strong>, H., Meyer, R., 2004. Assess<strong>in</strong>g satellite derived irradiance <strong>in</strong>formationfor South America with<strong>in</strong> the UNEP resource assessment project SWERA.In: Proceed<strong>in</strong>gs of the Fifth ISES Europe <strong>Solar</strong> Conference, Freiburg, Germany.European Database for Daylight and <strong>Solar</strong> Radiation, 2007. Onl<strong>in</strong>e: /http://www.satel-light.com/S.Goldemberg, J., Villanueva, L.D., 2003. Energia, meio ambiente e desenvolvimento,second ed. EDUSP, São Paulo, <strong>Brazil</strong> (<strong>in</strong> Portuguese).INMET, 2007. Normais Climatológicas. Instituto Nacional de Meteorologia. Onl<strong>in</strong>e:/http://www.<strong>in</strong>met.gov.br/html/clima.php/S.IPCC, 2007. In: Solomon, S., Qu<strong>in</strong>, D., Mann<strong>in</strong>g, M., Chen, Z., Marquis, M., Averyt,K.B., Tignor, M., Miller, H.L. (Eds.), IPCC Climate Change 2007: The physicalscience basis. Contribution of Work<strong>in</strong>g Group I to the Fourth AssessmentReport of the Intergovernmental Panel on Climate Change. CambridgeUniversity Press, Cambridge, UK and New York, p. 996 Onl<strong>in</strong>e: /htpp://www.ipcc.chS.Mart<strong>in</strong>s, F.R., 2001. Influência do processo de determ<strong>in</strong>ac-ão da cobertura de nuvense dos aerossóis de queimada no modelo físico de radiac-ão BRASIL-SR, Tese dedoutoramento. Instituto Nacional de Pesquisas Espaciais, São José dos Campos,p. 330 (<strong>in</strong> Portuguese).Mart<strong>in</strong>s, F.R., 2003. Cross validation of SWERA’s core radiative transfer models.First and Second Reports. Available at SWERA website: /http://swera.unep.-net/swera/S.Mart<strong>in</strong>s, F.R., Pereira, E.B., Yamashita, C., Pereira, S.V., Mantelli Neto, S., 2005. Basede dados climático-ambientais aplicados ao setor energético-Projeto sonda. In:Proceed<strong>in</strong>gs of XII Simpósio Brasileiro de Sensoriamento Remoto, INPE, SãoJosé dos Campos, <strong>Brazil</strong> (<strong>in</strong> Portuguese).Mart<strong>in</strong>s, F.R., Pereira, E.B., Silva, S.A.B., 2007. The <strong>in</strong>fluence of cloud cover <strong>in</strong>dex onthe accuracy of solar irradiance models. Journal of Meteorology and AtmosphericPhysics, <strong>in</strong> press, doi:10.1007/s00703-007-0272-5.Maxwell, E.L., George, R.L., Wilcox, S.M., 1998. A climatological solar radiationmodel. In: Proceed<strong>in</strong>gs, 1998 Annual Conference. American <strong>Solar</strong> EnergySociety, Albuquerque, NM, pp. 505–510.Pereira, E.B., Mart<strong>in</strong>s, F.R., Abreu, S.L., Couto, P., Stuhlmann, R., Colle, S., 2000.Effects of burn<strong>in</strong>g of biomass on satellite estimations of solar irradiation <strong>in</strong><strong>Brazil</strong>. <strong>Solar</strong> Energy 68 (1), 91–107.Pereira, E.B., Mart<strong>in</strong>s, F.R., Abreu, S.L., Rüther, R., 2006. <strong>Brazil</strong>ian Atlas for <strong>Solar</strong>Energy. <strong>Brazil</strong>ian Institute for Space Research, São José dos Campos, <strong>Brazil</strong>,66pp. Onl<strong>in</strong>e /http://www.<strong>in</strong>pe.br/sondaS.
ARTICLE IN PRESS2854F.R. Mart<strong>in</strong>s et al. / Energy Policy 36 (2008) 2843–2854Perez, R., Seals, R., Ineichen, P., Stewart, R., Menicucci, D., 1987. A new simplified versionof the Perez diffuse irradiance model for tilted surfaces. <strong>Solar</strong> Energy 39, 221–232.Sims, REH., 2004. Renewable <strong>energy</strong>: a response to climate change. <strong>Solar</strong> Energy76, 9–17.Stephens, G.L., 1978. Radiation profiles <strong>in</strong> extended water clouds. II: Parameterizationschemes. Journal of Atmospheric Science 35, 2123–2132.Stuhlmann, R., Rieland, M., Raschke, E., 1990. An improvement of the IGMK modelto derive total and diffuse solar radiation at the surface from satellite data.Journal of Applied Meteorology 29 (7), 586–603.Warren, S.G., Hahn, C.J., London, J., Cherv<strong>in</strong>, R.M., Jenn, E.R., 1986. Globaldistribution of total cloud cover and cloud types amount over land. DOE/ER/60085-H1, NCAR/TN-273+STR, NCAR Technical Notes.