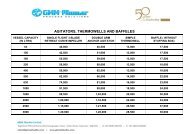
Financial Year - GMM Pfaudler Ltd
Financial Year - GMM Pfaudler Ltd
Financial Year - GMM Pfaudler Ltd

Create successful ePaper yourself
Turn your PDF publications into a flip-book with our unique Google optimized e-Paper software.
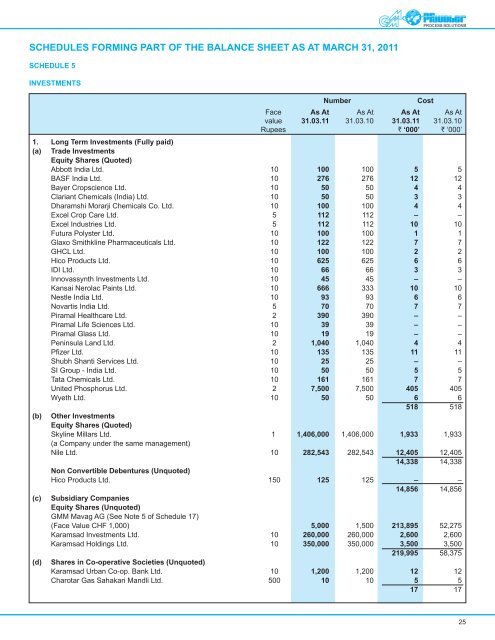
SCHEDULES FORMING PART OF THE BALANCE SHEET AS AT MARCH 31, 2011SCHEDULE 5INVESTMENTSNumberCostFace As At As At As At As Atvalue 31.03.11 31.03.10 31.03.11 31.03.10Rupees ` ‘000’ ` ‘000’1. Long Term Investments (Fully paid)(a) Trade InvestmentsEquity Shares (Quoted)Abbott India <strong>Ltd</strong>. 10 100 100 5 5BASF India <strong>Ltd</strong>. 10 276 276 12 12Bayer Cropscience <strong>Ltd</strong>. 10 50 50 4 4Clariant Chemicals (India) <strong>Ltd</strong>. 10 50 50 3 3Dharamshi Morarji Chemicals Co. <strong>Ltd</strong>. 10 100 100 4 4Excel Crop Care <strong>Ltd</strong>. 5 112 112 – –Excel Industries <strong>Ltd</strong>. 5 112 112 10 10Futura Polyster <strong>Ltd</strong>. 10 100 100 1 1Glaxo Smithkline Pharmaceuticals <strong>Ltd</strong>. 10 122 122 7 7GHCL <strong>Ltd</strong>. 10 100 100 2 2Hico Products <strong>Ltd</strong>. 10 625 625 6 6IDI <strong>Ltd</strong>. 10 66 66 3 3Innovassynth Investments <strong>Ltd</strong>. 10 45 45 – –Kansai Nerolac Paints <strong>Ltd</strong>. 10 666 333 10 10Nestle India <strong>Ltd</strong>. 10 93 93 6 6Novartis India <strong>Ltd</strong>. 5 70 70 7 7Piramal Healthcare <strong>Ltd</strong>. 2 390 390 – –Piramal Life Sciences <strong>Ltd</strong>. 10 39 39 – –Piramal Glass <strong>Ltd</strong>. 10 19 19 – –Peninsula Land <strong>Ltd</strong>. 2 1,040 1,040 4 4Pfizer <strong>Ltd</strong>. 10 135 135 11 11Shubh Shanti Services <strong>Ltd</strong>. 10 25 25 – –SI Group - India <strong>Ltd</strong>. 10 50 50 5 5Tata Chemicals <strong>Ltd</strong>. 10 161 161 7 7United Phosphorus <strong>Ltd</strong>. 2 7,500 7,500 405 405Wyeth <strong>Ltd</strong>. 10 50 50 6 6518 518(b) Other InvestmentsEquity Shares (Quoted)Skyline Millars <strong>Ltd</strong>. 1 1,406,000 1,406,000 1,933 1,933(a Company under the same management)Nile <strong>Ltd</strong>. 10 282,543 282,543 12,405 12,40514,338 14,338Non Convertible Debentures (Unquoted)Hico Products <strong>Ltd</strong>. 150 125 125 – –14,856 14,856(c) Subsidiary CompaniesEquity Shares (Unquoted)<strong>GMM</strong> Mavag AG (See Note 5 of Schedule 17)(Face Value CHF 1,000) 5,000 1,500 213,895 52,275Karamsad Investments <strong>Ltd</strong>. 10 260,000 260,000 2,600 2,600Karamsad Holdings <strong>Ltd</strong>. 10 350,000 350,000 3,500 3,500219,995 58,375(d) Shares in Co-operative Societies (Unquoted)Karamsad Urban Co-op. Bank <strong>Ltd</strong>. 10 1,200 1,200 12 12Charotar Gas Sahakari Mandli <strong>Ltd</strong>. 500 10 10 5 517 1725