Financial Year - GMM Pfaudler Ltd
Financial Year - GMM Pfaudler Ltd
Financial Year - GMM Pfaudler Ltd

You also want an ePaper? Increase the reach of your titles
YUMPU automatically turns print PDFs into web optimized ePapers that Google loves.
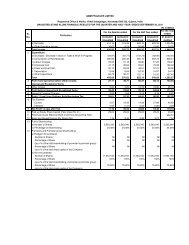
<strong>GMM</strong> PFAUDLER LIMITEDAnnual Report 2010 - 201113. SEGMENT REPORTING(a) Primary segment reporting by business segment (` in ‘000’)Particulars Chemical Processing Mixing Systems Filtration/Separation TotalEquipment Equipment & Others<strong>Year</strong> Ended 31.03.11 31.03.10 31.03.11 31.03.10 31.03.11 31.03.10 31.03.11 31.03.10Revenue:Total External sales 1,220,167 1,279,296 110,539 162,901 618,538 495,350 1,949,244 1,937,547Segment Results:Profit/(Loss) before Tax and Interest 177,413 185,889 10,830 18,444 14,998 (1,171) 203,241 203,162Unallocated Expense (Net) 19,930 (43,168)Less: Interest 8,870 7,844Profit Before Tax 174,441 152,150Taxes 53,105 55,859Net Profit After Tax 121,336 96,291Segment Assets 1,058,754 783,331 69,053 86,585 320,311 295,670 1,448,118 1,165,586Unallocated Assets 327,723 331,687Total Assets 1,775,841 1,497,273Segment liabilities 432,770 292,139 38,705 43,450 164,127 182,312 635,602 517,901Unallocated Liabilities 94,994 40,383Total Liabilities 730,596 558,284Capital Expenditure 28,296 15,957 – – 37,075 11,216 65,371 27,173Unallocated Capital Expenditure 12,687 2,852Depreciation 30,158 28,943 347 333 8,849 7,217 39,354 36,493Unallocated depreciation 3,977 2,667(b) Secondary segment reporting by geographical segment:(` in ‘000’)Particulars Within India Outside India Total<strong>Year</strong> Ended 31.03.11 31.03.10 31.03.11 31.03.10 31.03.11 31.03.10Revenue 1,405,885 1,463,400 543,359 474,147 1,949,244 1,937,547Notes:1) The Business segments have been identified in line with the Accounting Standard 17 on “Segment Reporting”, taking into account the nature of product, the nature ofmanufacturing process, the class of customers, the organization structure and the internal financial reporting system.2) Segment revenue, results, assets and liabilities include amounts that are directly attributable to the respective segments. Amounts not directly attributable have beenallocated to the segments on the best judgment of the management in the absence of detailed internal financial reporting system. Expenses not directly allocable to thesegments are treated as “Unallocated Expenses”14. Prior year’s figures have been regrouped where necessary.60