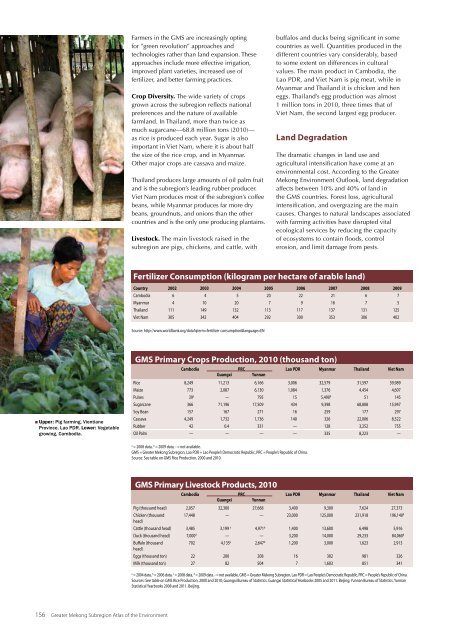
Farmers <strong>in</strong> <strong>the</strong> <strong>GMS</strong> are <strong>in</strong>creas<strong>in</strong>gly opt<strong>in</strong>gfor ”green revolution” approaches andtechnologies ra<strong>the</strong>r than land expansion. Theseapproaches <strong>in</strong>clude more effective irrigation,improved plant varieties, <strong>in</strong>creased use offertilizer, and better farm<strong>in</strong>g practices.Crop Diversity. The wide variety of cropsgrown across <strong>the</strong> subregion reflects nationalpreferences and <strong>the</strong> nature of availablefarmland. In Thailand, more than twice asmuch sugarcane—68.8 million tons (2010)—as rice is produced each year. Sugar is alsoimportant <strong>in</strong> Viet Nam, where it is about half<strong>the</strong> size of <strong>the</strong> rice crop, and <strong>in</strong> Myanmar.O<strong>the</strong>r major crops are cassava and maize.Thailand produces large amounts of oil palm fruitand is <strong>the</strong> subregion’s lead<strong>in</strong>g rubber producer.Viet Nam produces most of <strong>the</strong> subregion’s coffeebeans, while Myanmar produces far more drybeans, groundnuts, and onions than <strong>the</strong> o<strong>the</strong>rcountries and is <strong>the</strong> only one produc<strong>in</strong>g planta<strong>in</strong>s.Livestock. The ma<strong>in</strong> livestock raised <strong>in</strong> <strong>the</strong>subregion are pigs, chickens, and cattle, withbuffalos and ducks be<strong>in</strong>g significant <strong>in</strong> somecountries as well. Quantities produced <strong>in</strong> <strong>the</strong>different countries vary considerably, basedto some extent on differences <strong>in</strong> culturalvalues. The ma<strong>in</strong> product <strong>in</strong> Cambodia, <strong>the</strong>Lao PDR, and Viet Nam is pig meat, while <strong>in</strong>Myanmar and Thailand it is chicken and heneggs. Thailand’s egg production was almost1 million tons <strong>in</strong> 2010, three times that ofViet Nam, <strong>the</strong> second largest egg producer.<strong>Land</strong> DegradationThe dramatic changes <strong>in</strong> land use andagricultural <strong>in</strong>tensification have come at anenvironmental cost. Accord<strong>in</strong>g to <strong>the</strong> GreaterMekong Environment Outlook, land degradationaffects between 10% and 40% of land <strong>in</strong><strong>the</strong> <strong>GMS</strong> countries. Forest loss, agricultural<strong>in</strong>tensification, and overgraz<strong>in</strong>g are <strong>the</strong> ma<strong>in</strong>causes. Changes to natural landscapes associatedwith farm<strong>in</strong>g activities have disrupted vitalecological services by reduc<strong>in</strong>g <strong>the</strong> capacityof ecosystems to conta<strong>in</strong> floods, controlerosion, and limit damage from pests.Fertilizer Consumption (kilogram per <strong>hectare</strong> of arable land)Country 2002 2003 2004 2005 2006 2007 2008 2009Cambodia 6 4 5 20 22 21 6 7Myanmar 4 10 20 7 9 16 7 5Thailand 111 149 132 113 117 137 131 125Viet Nam 305 342 404 292 300 353 306 402Source: http://www.worldbank.org/data?qterm=fertilizer consumption&language=ENUpper: Pig farm<strong>in</strong>g, VientianeProv<strong>in</strong>ce, Lao PDR. Lower: Vegetablegrow<strong>in</strong>g, Cambodia.<strong>GMS</strong> Primary Crops Production, 2010 (<strong>thousand</strong> ton)Cambodia PRC Lao PDR Myanmar Thailand Viet NamGuangxiYunnanRice 8,249 11,213 6,166 3,006 32,579 31,597 39,989Maize 773 2,087 6,130 1,084 1,376 4,454 4,607Pulses 39 a — 795 15 5,490 b 51 145Sugarcane 366 71,196 17,509 434 9,398 68,808 15,947Soy Bean 157 167 271 16 259 177 297Cassava 4,249 1,732 1,736 140 326 22,006 8,522Rubber 42 0.4 331 — 128 3,252 755Oil Palm — — — — 335 8,223 —a= 2008 data, b = 2009 data, - = not available.<strong>GMS</strong> = Greater Mekong Subregion, Lao PDR = Lao People’s Democratic Republic, PRC = People’s Republic of Ch<strong>in</strong>a.Source: See table on <strong>GMS</strong> Rice Production, 2000 and 2010.<strong>GMS</strong> Primary Livestock Products, 2010Cambodia PRC Lao PDR Myanmar Thailand Viet NamGuangxiYunnanPig (<strong>thousand</strong> head) 2,057 32,300 27,668 3,400 9,300 7,624 27,373Chicken (<strong>thousand</strong>17,448 — — 23,000 125,000 231,918 196,140 dhead)Cattle (<strong>thousand</strong> head) 3,485 3,199 a 4,971 b 1,400 13,600 6,498 5,916Duck (<strong>thousand</strong> head) 7,000 d — — 3,200 14,000 29,233 84,060 dBuffalo (<strong>thousand</strong>702 4,135 a 2,647 b 1,200 3,000 1,623 2,913head)Eggs (<strong>thousand</strong> ton) 22 200 208 16 302 981 326Milk (<strong>thousand</strong> ton) 27 82 504 7 1,603 851 341a= 2004 data, b = 2006 data, c = 2008 data, d = 2009 data. - = not available, <strong>GMS</strong> = Greater Mekong Subregion, Lao PDR = Lao People’s Democratic Republic, PRC = People’s Republic of Ch<strong>in</strong>a.Sources: See table on <strong>GMS</strong> Rice Production, 2000 and 2010; Guangxi Bureau of Statistics. Guangxi Statistical Yearbooks 2005 and 2011. Beij<strong>in</strong>g; Yunnan Bureau of Statistics. YunnanStatistical Yearbooks 2008 and 2011. Beij<strong>in</strong>g.156 Greater Mekong Subregion Atlas of <strong>the</strong> Environment
The Causes and Extent of <strong>Land</strong>Degradation <strong>in</strong> <strong>the</strong> <strong>GMS</strong>CambodiaYunnanLao PDRMyanmarThailandViet NamCambodiaYunnanLao PDRMyanmarThailandViet NamCauses0% 10% 20% 30% 40% 50%Deforestration Overgraz<strong>in</strong>g Agriculture activitiesExtent0% 10% 20% 30% 40% 50%Light Moderate Strong<strong>GMS</strong> = Greater Mekong Subregion, Lao PDR = Lao People’s Democratic Republic.Source: Thailand M<strong>in</strong>istry of Natural Resources and Environment and UNEPRegional Resource Center for Asia and <strong>the</strong> Pacific. Thailand National EnvironmentalPerformance Assessment (EPA) Report. Bangkok. http://www.ekh.unep.org/files/SEF%20II%20Report%20-%20Thailand.pdfWater Use for AgricultureAgriculture is <strong>the</strong> largest user of water <strong>in</strong> all <strong>the</strong> <strong>GMS</strong>countries, consum<strong>in</strong>g between 58% <strong>in</strong> Guangxi,PRC, and 95% of total withdrawals. By alter<strong>in</strong>gnatural flow regimes, irrigation development hasaffected fish populations and wetland habitats. Theresult<strong>in</strong>g dry-season water shortages have <strong>in</strong>creasedcompetition for water, especially <strong>in</strong> <strong>in</strong>tensivelyirrigatedareas, such as Viet Nam’s Red River Deltaand Thailand’s Chao Phraya River Delta. Hydropowerschemes planned for <strong>the</strong> Mekong, Thanlw<strong>in</strong>, andAyeyarwady rivers will disrupt natural flows fur<strong>the</strong>r,with implications for farm<strong>in</strong>g and fisheries. Block<strong>in</strong>gfish migration paths with dams, for example, prevents<strong>the</strong>ir reach<strong>in</strong>g spawn<strong>in</strong>g and feed<strong>in</strong>g areas.Irrigation consumes an estimated 41.8 billioncubic meters of freshwater <strong>in</strong> <strong>the</strong> lower Mekongbas<strong>in</strong>, which <strong>in</strong>cludes parts of Cambodia, LaoPDR, Thailand, and Viet Nam. More than halfof <strong>the</strong> water is used <strong>in</strong> Viet Nam <strong>in</strong> <strong>the</strong> MekongDelta (26.3 billion cubic meters), followed byThailand (9.5 billion), <strong>the</strong> Lao PDR (3.0 billion),Cambodia (2.7 billion), and <strong>the</strong> highlands ofViet Nam (0.5 billion). Water-use strategies rangefrom supplementary water dur<strong>in</strong>g <strong>the</strong> wet seasonto fully irrigated multicropp<strong>in</strong>g strategies.The area under irrigation has expanded gradually<strong>in</strong> all countries. Most of <strong>the</strong> <strong>in</strong>stalled irrigation<strong>in</strong>frastructure is found <strong>in</strong> nor<strong>the</strong>astern Thailand andViet Nam’s Mekong Delta. A recent assessmentof irrigation <strong>in</strong> <strong>the</strong> lower Mekong bas<strong>in</strong> recordedalmost 15,000 <strong>in</strong>dividual irrigation projects,vary<strong>in</strong>g from small to large scale, and fromgravity-fed to pump-fed irrigation. The totalarea under irrigation <strong>in</strong> <strong>the</strong> lower Mekong bas<strong>in</strong>is estimated at 4 million <strong>hectare</strong>s, of which3.5 million are irrigated <strong>in</strong> <strong>the</strong> wet season,1.2 million <strong>in</strong> <strong>the</strong> dry season, and about 1.5million <strong>hectare</strong>s where a third crop is grown.Area of Irrigated Rice andO<strong>the</strong>r Crops <strong>in</strong> <strong>the</strong> LowerMekong Bas<strong>in</strong>, 2007 (<strong>hectare</strong>)CountryIrrigableArea1stSeasonRice2ndSeason3rdSeasonNon-riceCropAreaAnnualIrrigatedAreaCambodia 504,245 273,337 260,815 16,713 12,172 563,037Lao PDR 166,476 166,476 97,224 — 6.977 270,677Thailand 1,411,807 1,354,804 148,255 — 252,704 1,755,763Viet NamTotal 1,919,623 739,594 1,478,740 329,740 4,217,983Delta 1,528,225 663,410 1,478,740 294,899 3,965,274141,684 76,184 34,841 252,709HighlandsTotal LMB 4,002,151 3,464,526 1,245,888 1,495,453 601,593 6,807,460- = not available, <strong>GMS</strong> = Greater Mekong Subregion, Lao PDR = Lao People’s DemocraticRepublic, LMB = lower Mekong bas<strong>in</strong>.Source: Mekong River Commission. 2010. State of <strong>the</strong> Bas<strong>in</strong> Report 2010. Vientiane.Upper: Cattle farm<strong>in</strong>g, Thailand.Lower: <strong>Land</strong> cleared for shift<strong>in</strong>gcultivation of rice or maize, centralAnnamites, Viet Nam.Agriculture, Fisheries, and Food Security 157
- Page 3: Importance of Rice. The GMS is home
- Page 7 and 8: Agroecological ZonesThe GMS compris
- Page 9 and 10: whom 46 million live in Yunnan Prov
- Page 11: Agriculture, Fisheries, and Food Se
- Page 18 and 19: Upper: Fish from the Mekong River f
- Page 20: 172 Greater Mekong Subregion Atlas
- Page 24 and 25: Above:Province, central Viet Nam. R
- Page 26: e severe. With rapidly declining pu
- Page 29 and 30: Annual Irrigation Demand, LowerMeko
- Page 31 and 32: as a major source of food, mean tha
- Page 33 and 34: EnergyOver the last two decades, ra
- Page 35 and 36: equirements that marked the previou
- Page 37 and 38: Energy Resource Base in the GMSCoun
- Page 39 and 40: generation biofuels, have begun to
- Page 41 and 42: energy. Use of renewable energy exp
- Page 44 and 45: 196 Greater Mekong Subregion Atlas
- Page 46 and 47: Upper and Lower: Construction of th
- Page 48 and 49: 200 Greater Mekong Subregion Atlas
- Page 50 and 51: 1990Nay Pyi Taw, Myanmar(Left)and 2
- Page 52 and 53: Upper: Bangkok’s mass transitsyst
- Page 54 and 55:
Satellite images of Kunming City, c
- Page 56 and 57:
Number of Vehicles per 1,000Persons
- Page 58 and 59:
210 Greater Mekong Subregion Atlas
- Page 60 and 61:
GMS Passenger Transport (million pa
- Page 62 and 63:
Rush hour traffic in Ho Chi Minh Ci
- Page 64 and 65:
Traffic congestion in Bangkok,Thail
- Page 66 and 67:
Rehabilitated passenger train,Cambo
- Page 68 and 69:
kilometers in 2008. Most lines run
- Page 70 and 71:
Upper left: Yangon River port,Myamn
- Page 72 and 73:
224 Greater Mekong Subregion Atlas
- Page 74:
Suvarnabhumi airport terminal,Bangk
- Page 77 and 78:
GMS International Tourist Arrivals
- Page 80 and 81:
232 Greater Mekong Subregion Atlas
- Page 82 and 83:
Satellite images showing developmen
- Page 84:
While GMS tourism growth is predomi