Upper: Bangkok’s mass transitsystem, <strong>the</strong> Skytra<strong>in</strong>, provides efficienttransport for <strong>the</strong> city’s grow<strong>in</strong>gnumbers of commuters. Lower: Motorcycles fill <strong>the</strong> streets of cities andtowns <strong>in</strong> Viet Nam.widened <strong>the</strong> rural-urban poverty gap. S<strong>in</strong>ce 1997,urbanization has largely taken place <strong>in</strong> peri-urbanareas that extend up to 75 kilometers around <strong>the</strong>large cities because of <strong>the</strong> improved transport andcommunication network. The 1999 DecentralizationLaw addresses <strong>the</strong> extensive centralization of<strong>the</strong> adm<strong>in</strong>istration and <strong>in</strong>creases <strong>the</strong> number ofmunicipalities from 149 to 1,129—creat<strong>in</strong>g ashortage of qualified skilled persons <strong>in</strong> <strong>the</strong> NationalCivil Service. The Bangkok Metropolitan Regioncovers an area of 7,762 square kilometers and hadan estimated population of 12 million <strong>in</strong> 2008, witha population density of 1,301 per square kilometer.Due to <strong>the</strong> success of <strong>the</strong> service and tourism<strong>in</strong>dustries <strong>in</strong> Bangkok, <strong>the</strong> city has ga<strong>in</strong>ed <strong>in</strong>popularity for work not only among prov<strong>in</strong>cialThais from <strong>the</strong> rural areas but also with peoplefrom o<strong>the</strong>r countries <strong>in</strong> <strong>the</strong> subregion and beyond.Many workers reside outside <strong>the</strong> metropolitan areaand travel <strong>in</strong>to <strong>the</strong> city for day jobs. The populationswells to 15–20 million <strong>in</strong> <strong>the</strong> city dur<strong>in</strong>g <strong>the</strong> day.Peri-urban areas accommodated almost 90%of <strong>the</strong> recent population growth, <strong>in</strong>dicat<strong>in</strong>g <strong>the</strong>importance of <strong>the</strong>se areas.Bangkok Metropolitan Region –Population Growth and DensityAdm<strong>in</strong>istrativeAreaBangkokMunicipalityArea (km²)Population(2000)Population(2010)PopulationDensity(persons/km²)1,568.74 6,355,144 8,249,117 5,258.6Nonthaburi 622.30 816,614 1,333,623 2,143.1Samut Prakan 1,004.50 1,028,401 1,828,044 1,820.6Pathum Thani 1,525.90 677,649 1,326,617 869.4Samut Sakhon 872.30 466,281 885,559 1015.2Nakhon Pathom 2,168.30 815,122 942,560 434.7Greater Bangkok 7,762.00 10,159,211 14,565,520 1,876.6Source: Census data, 2010. http://www.citypopulation.de/php/thailand-adm<strong>in</strong>.phpViet Nam’s rapid urbanization is due to <strong>the</strong>transformation of an agriculture-based economy <strong>in</strong>toan <strong>in</strong>dustrialized economy, which has put enormouspressure on <strong>the</strong> Government to <strong>in</strong>vest <strong>in</strong> urban<strong>in</strong>frastructure. The degradation of environmentalquality and sanitary hygiene associated with denseliv<strong>in</strong>g has become acute as more people migrateto <strong>the</strong> cities, prompt<strong>in</strong>g <strong>the</strong> Government to embarkon environmental improvement programs. VietNam’s urban areas contribute 70% of <strong>the</strong> country’seconomic growth. The urban share of <strong>the</strong> populationis not uniform across regions, be<strong>in</strong>g significantlyhigher (57%) <strong>in</strong> <strong>the</strong> sou<strong>the</strong>ast than <strong>in</strong> o<strong>the</strong>r regions,due to <strong>the</strong> presence of Ho Chi M<strong>in</strong>h City. Second<strong>in</strong> density (29%) is <strong>the</strong> Red River Delta, due to <strong>the</strong>presence of Ha Noi and Hai Phong.Urban Share of Population byRegion <strong>in</strong> Viet Nam, 2009 (%)Exclud<strong>in</strong>g 5 CentralRegionCity-Prov<strong>in</strong>ces*Nor<strong>the</strong>rn Midlands and16.0 16.0Mounta<strong>in</strong>sRed River Delta 19.9 29.220.9 24.1North and South CentralCoastInclud<strong>in</strong>g 5 CentralCity-Prov<strong>in</strong>cesCentral Highlands 27.8 27.8Sou<strong>the</strong>ast 30.1 57.1Mekong River Delta 19.6 22.85 Central City-Prov<strong>in</strong>ces 62.7 62.7* Central city-prov<strong>in</strong>ces are 5 municipalities that are adm<strong>in</strong>istratively equivalent toprov<strong>in</strong>ces and directly under <strong>the</strong> central government; <strong>the</strong>y are Ha Noi, Ho Chi M<strong>in</strong>h City,Hai Phong, Da Nang, and Can Tho.Source: M<strong>in</strong>istry of Plann<strong>in</strong>g and Investment, General Statistics Office. 2011. Viet NamPopulation and Hous<strong>in</strong>g Census 2009. Migration and Urbanization <strong>in</strong> Viet Nam: Patterns,Trends and Differentials. Ha Noi. http://unfpa.org/webdav/site/vietnam/shared/Census%20publications/7_Monograph-Migration-Urbanization.pdfIn Viet Nam, cites are adm<strong>in</strong>istrative units that<strong>in</strong>clude territory outside <strong>the</strong> city center, i.e., ruralareas. In 1989, three quarters of Ho Chi M<strong>in</strong>h Citywas urban, while only a third of Ha Noi and Hai204 Greater Mekong Subregion Atlas of <strong>the</strong> Environment
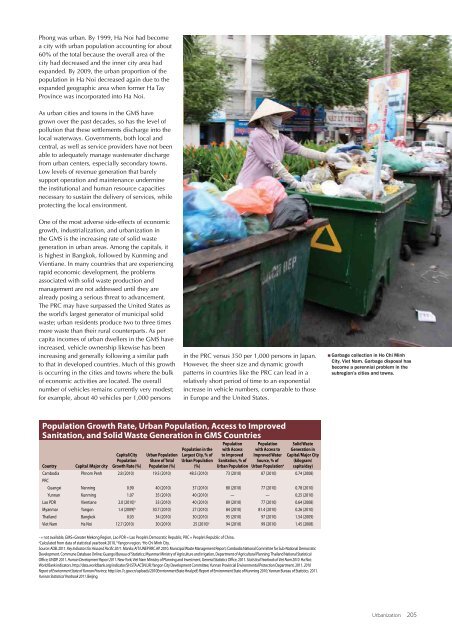
Phong was urban. By 1999, Ha Noi had becomea city with urban population account<strong>in</strong>g for about60% of <strong>the</strong> total because <strong>the</strong> overall area of <strong>the</strong>city had decreased and <strong>the</strong> <strong>in</strong>ner city area hadexpanded. By 2009, <strong>the</strong> urban proportion of <strong>the</strong>population <strong>in</strong> Ha Noi decreased aga<strong>in</strong> due to <strong>the</strong>expanded geographic area when former Ha TayProv<strong>in</strong>ce was <strong>in</strong>corporated <strong>in</strong>to Ha Noi.As urban cities and towns <strong>in</strong> <strong>the</strong> <strong>GMS</strong> havegrown over <strong>the</strong> past decades, so has <strong>the</strong> level ofpollution that <strong>the</strong>se settlements discharge <strong>in</strong>to <strong>the</strong>local waterways. Governments, both local andcentral, as well as service providers have not beenable to adequately manage wastewater dischargefrom urban centers, especially secondary towns.Low levels of revenue generation that barelysupport operation and ma<strong>in</strong>tenance underm<strong>in</strong>e<strong>the</strong> <strong>in</strong>stitutional and human resource capacitiesnecessary to susta<strong>in</strong> <strong>the</strong> delivery of services, whileprotect<strong>in</strong>g <strong>the</strong> local environment.One of <strong>the</strong> most adverse side-effects of economicgrowth, <strong>in</strong>dustrialization, and urbanization <strong>in</strong><strong>the</strong> <strong>GMS</strong> is <strong>the</strong> <strong>in</strong>creas<strong>in</strong>g rate of solid wastegeneration <strong>in</strong> urban areas. Among <strong>the</strong> capitals, itis highest <strong>in</strong> Bangkok, followed by Kunm<strong>in</strong>g andVientiane. In many countries that are experienc<strong>in</strong>grapid economic development, <strong>the</strong> problemsassociated with solid waste production andmanagement are not addressed until <strong>the</strong>y arealready pos<strong>in</strong>g a serious threat to advancement.The PRC may have surpassed <strong>the</strong> United States as<strong>the</strong> world’s largest generator of municipal solidwaste; urban residents produce two to three timesmore waste than <strong>the</strong>ir rural counterparts. As percapita <strong>in</strong>comes of urban dwellers <strong>in</strong> <strong>the</strong> <strong>GMS</strong> have<strong>in</strong>creased, vehicle ownership likewise has been<strong>in</strong>creas<strong>in</strong>g and generally follow<strong>in</strong>g a similar pathto that <strong>in</strong> developed countries. Much of this growthis occurr<strong>in</strong>g <strong>in</strong> <strong>the</strong> cities and towns where <strong>the</strong> bulkof economic activities are located. The overallnumber of vehicles rema<strong>in</strong>s currently very modest;for example, about 40 vehicles per 1,000 persons<strong>in</strong> <strong>the</strong> PRC versus 350 per 1,000 persons <strong>in</strong> Japan.However, <strong>the</strong> sheer size and dynamic growthpatterns <strong>in</strong> countries like <strong>the</strong> PRC can lead <strong>in</strong> arelatively short period of time to an exponential<strong>in</strong>crease <strong>in</strong> vehicle numbers, comparable to those<strong>in</strong> Europe and <strong>the</strong> United States.Garbage collection <strong>in</strong> Ho Chi M<strong>in</strong>hCity, Viet Nam. Garbage disposal hasbecome a perennial problem <strong>in</strong> <strong>the</strong>subregion’s cities and towns.Population Growth Rate, Urban Population, Access to ImprovedSanitation, and Solid Waste Generation <strong>in</strong> <strong>GMS</strong> CountriesCountryCapital /Major cityCapital/CityPopulationGrowth Rate (%)Urban PopulationShare of TotalPopulation (%)Population <strong>in</strong> <strong>the</strong>Largest City, % ofUrban Population(%)Populationwith Accessto ImprovedSanitation, % ofUrban PopulationPopulationwith Access toImproved WaterSource, % ofUrban Population aSolid WasteGeneration <strong>in</strong>Capital/Major City(kilogram/capita/day)Cambodia Phnom Penh 2.8 (2010) 19.5 (2010) 48.5 (2010) 73 (2010) 87 (2010) 0.74 (2008)PRCGuangxi Nann<strong>in</strong>g 0.90 40 (2010) 37 (2010) 80 (2010) 77 (2010) 0.78 (2010)Yunnan Kunm<strong>in</strong>g 1.07 35 (2010) 40 (2010) — — 0.25 (2010)Lao PDR Vientiane 2.0 (2010) a 33 (2010) 40 (2010) 89 (2010) 77 (2010) 0.64 (2008)Myanmar Yangon 1.4 (2009) b 30.7 (2010) 27 (2010) 84 (2010) 81.4 (2010) 0.26 (2010)Thailand Bangkok 0.03 34 (2010) 30 (2010) 95 (2010) 97 (2010) 1.54 (2009)Viet Nam Ha Noi 12.7 (2010) 30 (2010) 25 (2010) c 94 (2010) 99 (2010) 1.45 (2008)- = not available, <strong>GMS</strong>=Greater Mekong Region, Lao PDR = Lao People’s Democratic Republic, PRC = People’s Republic of Ch<strong>in</strong>a.aCalculated from data of statistical yearbook 2010, b Yangon region, c Ho Chi M<strong>in</strong>h City.Source: ADB. 2011. Key Indicators for Asia and Pacific 2011. Manila; AIT/UNEP RRC.AP. 2010. Municipal Waste Management Report; Cambodia National Committee for Sub-National DemocraticDevelopment. Commune Database Onl<strong>in</strong>e; Guangxi Bureau of Statistics; Myanmar M<strong>in</strong>istry of Agriculture and Irrigation, Department of <strong>Agricultural</strong> Plann<strong>in</strong>g; Thailand National StatisticalOffice; UNDP. 2011. Human Development Report 2011. New York; Viet Nam M<strong>in</strong>istry of Plann<strong>in</strong>g and Investment, General Statistics Office. 2011. Statistical Yearbook of Viet Nam 2010. Ha Noi;World Bank <strong>in</strong>dicators. http://data.worldbank.org/<strong>in</strong>dicator/SH.STA.ACSN.UR; Yangon City Development Committee; Yunnan Prov<strong>in</strong>cial Environmental Protection Department. 2011. 2010Report of Environment State of Yunnan Prov<strong>in</strong>ce. http://en.7c.gov.cn/uploads/2010EnvrionmentState-f<strong>in</strong>al.pdf; Report of Environment State of Kunm<strong>in</strong>g 2010; Yunnan Bureau of Statistics. 2011.Yunnan Statistical Yearbook 2011. Beij<strong>in</strong>g.Urbanization 205
- Page 3 and 4: Importance of Rice. The GMS is home
- Page 5 and 6: The Causes and Extent of LandDegrad
- Page 7 and 8: Agroecological ZonesThe GMS compris
- Page 9 and 10: whom 46 million live in Yunnan Prov
- Page 11: Agriculture, Fisheries, and Food Se
- Page 18 and 19: Upper: Fish from the Mekong River f
- Page 20: 172 Greater Mekong Subregion Atlas
- Page 24 and 25: Above:Province, central Viet Nam. R
- Page 26: e severe. With rapidly declining pu
- Page 29 and 30: Annual Irrigation Demand, LowerMeko
- Page 31 and 32: as a major source of food, mean tha
- Page 33 and 34: EnergyOver the last two decades, ra
- Page 35 and 36: equirements that marked the previou
- Page 37 and 38: Energy Resource Base in the GMSCoun
- Page 39 and 40: generation biofuels, have begun to
- Page 41 and 42: energy. Use of renewable energy exp
- Page 44 and 45: 196 Greater Mekong Subregion Atlas
- Page 46 and 47: Upper and Lower: Construction of th
- Page 48 and 49: 200 Greater Mekong Subregion Atlas
- Page 50 and 51: 1990Nay Pyi Taw, Myanmar(Left)and 2
- Page 54 and 55: Satellite images of Kunming City, c
- Page 56 and 57: Number of Vehicles per 1,000Persons
- Page 58 and 59: 210 Greater Mekong Subregion Atlas
- Page 60 and 61: GMS Passenger Transport (million pa
- Page 62 and 63: Rush hour traffic in Ho Chi Minh Ci
- Page 64 and 65: Traffic congestion in Bangkok,Thail
- Page 66 and 67: Rehabilitated passenger train,Cambo
- Page 68 and 69: kilometers in 2008. Most lines run
- Page 70 and 71: Upper left: Yangon River port,Myamn
- Page 72 and 73: 224 Greater Mekong Subregion Atlas
- Page 74: Suvarnabhumi airport terminal,Bangk
- Page 77 and 78: GMS International Tourist Arrivals
- Page 80 and 81: 232 Greater Mekong Subregion Atlas
- Page 82 and 83: Satellite images showing developmen
- Page 84: While GMS tourism growth is predomi