Agricultural Land in the GMS (thousand hectare) in ... - GMS-EOC
Agricultural Land in the GMS (thousand hectare) in ... - GMS-EOC
Agricultural Land in the GMS (thousand hectare) in ... - GMS-EOC

You also want an ePaper? Increase the reach of your titles
YUMPU automatically turns print PDFs into web optimized ePapers that Google loves.
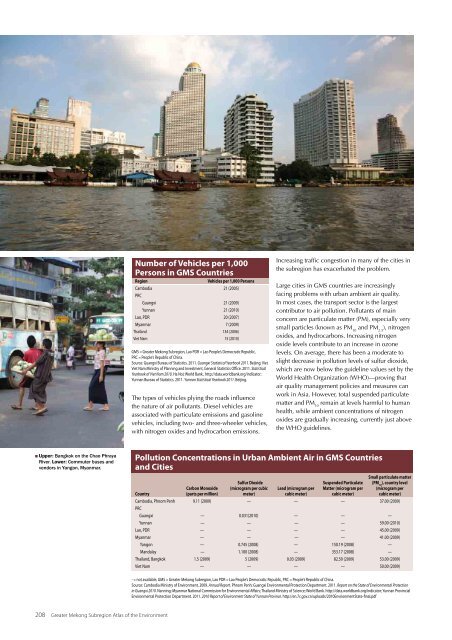
Number of Vehicles per 1,000Persons <strong>in</strong> <strong>GMS</strong> CountriesRegionVehicles per 1,000 PersonsCambodia 21 (2005)PRCGuangxi 21 (2009)Yunnan 21 (2010)Lao, PDR 20 (2007)Myanmar 7 (2009)Thailand 134 (2006)Viet Nam 15 (2010)<strong>GMS</strong> = Greater Mekong Subregion, Lao PDR = Lao People’s Democratic Republic,PRC = People’s Republic of Ch<strong>in</strong>a.Source: Guangxi Bureau of Statistics. 2011. Guangxi Statistical Yearbook 2011. Beij<strong>in</strong>g; VietViet Nam M<strong>in</strong>istry of Plann<strong>in</strong>g and Investment, General Statistics Office. 2011. StatisticalYearbook of Viet Nam 2010. Ha Noi; World Bank.. http://data.worldbank.org/<strong>in</strong>dicator;Yunnan Bureau of Statistics. 2011. Yunnan Statistical Yearbook 2011. Beij<strong>in</strong>g.The types of vehicles ply<strong>in</strong>g <strong>the</strong> roads <strong>in</strong>fluence<strong>the</strong> nature of air pollutants. Diesel vehicles areassociated with particulate emissions and gasol<strong>in</strong>evehicles, <strong>in</strong>clud<strong>in</strong>g two- and three-wheeler vehicles,with nitrogen oxides and hydrocarbon emissions.Increas<strong>in</strong>g traffic congestion <strong>in</strong> many of <strong>the</strong> cities <strong>in</strong><strong>the</strong> subregion has exacerbated <strong>the</strong> problem.Large cities <strong>in</strong> <strong>GMS</strong> countries are <strong>in</strong>creas<strong>in</strong>glyfac<strong>in</strong>g problems with urban ambient air quality.In most cases, <strong>the</strong> transport sector is <strong>the</strong> largestcontributor to air pollution. Pollutants of ma<strong>in</strong>concern are particulate matter (PM), especially verysmall particles (known as PM 10and PM 2.5), nitrogenoxides, and hydrocarbons. Increas<strong>in</strong>g nitrogenoxide levels contribute to an <strong>in</strong>crease <strong>in</strong> ozonelevels. On average, <strong>the</strong>re has been a moderate toslight decrease <strong>in</strong> pollution levels of sulfur dioxide,which are now below <strong>the</strong> guidel<strong>in</strong>e values set by <strong>the</strong>World Health Organization (WHO)—prov<strong>in</strong>g thatair quality management policies and measures canwork <strong>in</strong> Asia. However, total suspended particulatematter and PM 10rema<strong>in</strong> at levels harmful to humanhealth, while ambient concentrations of nitrogenoxides are gradually <strong>in</strong>creas<strong>in</strong>g, currently just above<strong>the</strong> WHO guidel<strong>in</strong>es.Upper: Bangkok on <strong>the</strong> Chao PhrayaRiver. Lower: Commuter buses andvendors <strong>in</strong> Yangon, Myanmar.Pollution Concentrations <strong>in</strong> Urban Ambient Air <strong>in</strong> <strong>GMS</strong> Countriesand CitiesCountryCarbon Monoxide(parts per million)Sulfur Dioxide(microgram per cubicmeter)Lead (microgram percubic meter)Suspended ParticulateMatter (microgram percubic meter)Small particulate matter(PM 10), country level(microgram percubic meter)Cambodia, Phnom Penh 9.11 (2009) — — — 37.00 (2009)PRCGuangxi — 0.031(2010) — — —Yunnan — — — — 59.00 (2010)Lao, PDR — — — — 45.00 (2009)Myanmar — — — — 41.00 (2009)Yangon — 0.745 (2008) — 150.19 (2008) —Mandalay — 1.100 (2008) — 353.17 (2008) —Thailand, Bangkok 1.5 (2009) 5 (2009) 0.03 (2009) 82.50 (2009) 53.00 (2009)Viet Nam — — — — 50.00 (2009)- = not available, <strong>GMS</strong> = Greater Mekong Subregion, Lao PDR = Lao People’s Democratic Republic, PRC = People’s Republic of Ch<strong>in</strong>a.Source: Cambodia M<strong>in</strong>istry of Environment. 2009. Annual Report. Phnom Penh; Guangxi Environmental Protection Department. 2011. Report on <strong>the</strong> State of Environmental Protection<strong>in</strong> Guangxi 2010. Nann<strong>in</strong>g; Myanmar National Commission for Environmental Affairs; Thailand M<strong>in</strong>istry of Science; World Bank. http://data.worldbank.org/<strong>in</strong>dicator; Yunnan Prov<strong>in</strong>cialEnvironmental Protection Department. 2011. 2010 Report of Environment State of Yunnan Prov<strong>in</strong>ce. http://en.7c.gov.cn/uploads/2010EnvrionmentState-f<strong>in</strong>al.pdf208 Greater Mekong Subregion Atlas of <strong>the</strong> Environment