158 Greater Mekong Subregion Atlas of <strong>the</strong> Environment
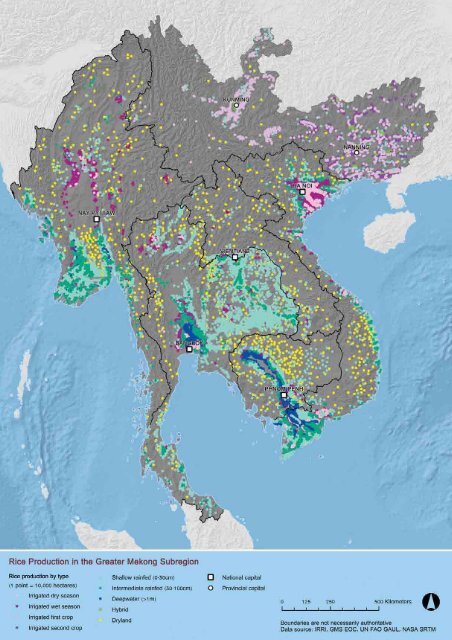
Agroecological ZonesThe <strong>GMS</strong> comprises four agroecological zones thathave common farm<strong>in</strong>g systems and are subjectto similar geographic constra<strong>in</strong>ts and risks.Deltas and <strong>the</strong> Tonle Sap Floodpla<strong>in</strong>. TheTonle Sap floodpla<strong>in</strong> and mega deltas of <strong>the</strong> Red,Mekong, Chao Phraya, and Ayeyarwady riversrepresent around 8% of <strong>the</strong> total <strong>GMS</strong> land areabut house over a third of <strong>the</strong> total population, some86 million people. Rural population densities arehigh and each delta hosts a major city. The citiesprovide markets and fuel demand for staples,vegetables, poultry, and meat. The ma<strong>in</strong> delta“rice bowls” of <strong>the</strong> <strong>GMS</strong> vary from <strong>the</strong> Tonle Sapfloodpla<strong>in</strong> and <strong>the</strong> Ayeyarwady Delta, which stillhave limited irrigation and low populations, to<strong>the</strong> densely settled and <strong>in</strong>tensively farmed ChaoPhraya, Mekong, and Red River deltas; <strong>the</strong> latterproduce two or three crops a year and have highlydeveloped irrigation <strong>in</strong>frastructure (dykes, levees,and canals to divert and reta<strong>in</strong> water). But <strong>the</strong>y allsuffer from water shortages <strong>in</strong> <strong>the</strong> dry season. In<strong>the</strong> Mekong Delta <strong>in</strong> Viet Nam, more than 80% ofdry-season flows are diverted for irrigation, result<strong>in</strong>g<strong>in</strong> local water shortages and seawater <strong>in</strong>trusion.The deltas and <strong>the</strong> Tonle Sap floodpla<strong>in</strong> supportextensive capture fisheries, as well as rapidlyexpand<strong>in</strong>g brackishwater and freshwateraquaculture. The Mekong Delta accounts for70% of Viet Nam’s aquaculture productionand 63% of its mar<strong>in</strong>e capture fisheries. TheTonle Sap floodpla<strong>in</strong> is particularly importantbecause of its productivity and l<strong>in</strong>k to <strong>the</strong> <strong>in</strong>landfisheries of <strong>the</strong> lower Mekong bas<strong>in</strong>, <strong>in</strong>clud<strong>in</strong>gCambodia, Lao PDR, and Viet Nam. The TonleSap fishery alone accounts for almost two thirdsof Cambodia’s <strong>in</strong>land fishery catch and accord<strong>in</strong>gto <strong>the</strong> National Accounts of Cambodia <strong>the</strong>fisheries sector made up 7.5% of GDP <strong>in</strong> 2010.Lowland Pla<strong>in</strong>s and Plateaus. Lowland pla<strong>in</strong>sand plateaus—from forests grow<strong>in</strong>g <strong>in</strong> nor<strong>the</strong>rnCambodia to <strong>the</strong> partially irrigated, extensiveagriculture of <strong>the</strong> Isan Plateau, to <strong>the</strong> highlyirrigated Central Thailand pla<strong>in</strong>—make up a quarterof <strong>the</strong> <strong>GMS</strong> and house 64 million people. Apartfrom sparsely populated nor<strong>the</strong>rn Cambodia,population densities are moderate and povertyis widespread. Lowland pla<strong>in</strong>s have been largelycleared for agriculture <strong>in</strong> Thailand and Myanmar,with <strong>the</strong> rema<strong>in</strong><strong>in</strong>g native vegetation limitedto higher, steeper land. Significant stands offorest rema<strong>in</strong> <strong>in</strong> nor<strong>the</strong>astern Cambodia and <strong>the</strong>sou<strong>the</strong>rn Lao PDR. Poor soils are widespread,access to water is limited, and <strong>the</strong> rema<strong>in</strong><strong>in</strong>gforests have significant conservation value.Agriculture is mostly ra<strong>in</strong>fed, although annualra<strong>in</strong>fall is generally low. Lowland pla<strong>in</strong>s andplateaus produce a quarter of <strong>the</strong> <strong>GMS</strong>’s rice,mostly <strong>in</strong> <strong>the</strong> wet season. In <strong>the</strong> dry season,farmers graze livestock on <strong>the</strong> rice stubble,plant<strong>in</strong>g a second crop of irrigated rice, orgrow<strong>in</strong>g irrigated sugarcane, maize, legumes,pulses, or cassava. Large herds of cattle andbuffalo graze <strong>in</strong> <strong>the</strong> pla<strong>in</strong>s and plateaus. Cattleare progressively replac<strong>in</strong>g buffalo due tomechanization and dietary preferences for beef.Large-scale plantations of oil palm, rubber,eucalyptus, sugarcane, cassava, and o<strong>the</strong>r <strong>in</strong>dustrialcrops are <strong>in</strong>creas<strong>in</strong>g on <strong>the</strong> pla<strong>in</strong>s and plateaus.For example, by 2007, Lao PDR had grantedUpper: Manual tractor, Yunnan, PRC,called <strong>the</strong> “iron buffalo” <strong>in</strong> some lowerMekong countries. Lower: Carry<strong>in</strong>gfreshly harvested sugarcane, Guangxi,PRC. Women carry out vital farm<strong>in</strong>gtasks across <strong>the</strong> subregion.Agriculture, Fisheries, and Food Security 159
- Page 3 and 4: Importance of Rice. The GMS is home
- Page 5: The Causes and Extent of LandDegrad
- Page 9 and 10: whom 46 million live in Yunnan Prov
- Page 11: Agriculture, Fisheries, and Food Se
- Page 18 and 19: Upper: Fish from the Mekong River f
- Page 20: 172 Greater Mekong Subregion Atlas
- Page 24 and 25: Above:Province, central Viet Nam. R
- Page 26: e severe. With rapidly declining pu
- Page 29 and 30: Annual Irrigation Demand, LowerMeko
- Page 31 and 32: as a major source of food, mean tha
- Page 33 and 34: EnergyOver the last two decades, ra
- Page 35 and 36: equirements that marked the previou
- Page 37 and 38: Energy Resource Base in the GMSCoun
- Page 39 and 40: generation biofuels, have begun to
- Page 41 and 42: energy. Use of renewable energy exp
- Page 44 and 45: 196 Greater Mekong Subregion Atlas
- Page 46 and 47: Upper and Lower: Construction of th
- Page 48 and 49: 200 Greater Mekong Subregion Atlas
- Page 50 and 51: 1990Nay Pyi Taw, Myanmar(Left)and 2
- Page 52 and 53: Upper: Bangkok’s mass transitsyst
- Page 54 and 55: Satellite images of Kunming City, c
- Page 56 and 57:
Number of Vehicles per 1,000Persons
- Page 58 and 59:
210 Greater Mekong Subregion Atlas
- Page 60 and 61:
GMS Passenger Transport (million pa
- Page 62 and 63:
Rush hour traffic in Ho Chi Minh Ci
- Page 64 and 65:
Traffic congestion in Bangkok,Thail
- Page 66 and 67:
Rehabilitated passenger train,Cambo
- Page 68 and 69:
kilometers in 2008. Most lines run
- Page 70 and 71:
Upper left: Yangon River port,Myamn
- Page 72 and 73:
224 Greater Mekong Subregion Atlas
- Page 74:
Suvarnabhumi airport terminal,Bangk
- Page 77 and 78:
GMS International Tourist Arrivals
- Page 80 and 81:
232 Greater Mekong Subregion Atlas
- Page 82 and 83:
Satellite images showing developmen
- Page 84:
While GMS tourism growth is predomi