Suren Kandasamy Dissertation.pdf - University of Surrey
Suren Kandasamy Dissertation.pdf - University of Surrey
Suren Kandasamy Dissertation.pdf - University of Surrey

You also want an ePaper? Increase the reach of your titles
YUMPU automatically turns print PDFs into web optimized ePapers that Google loves.
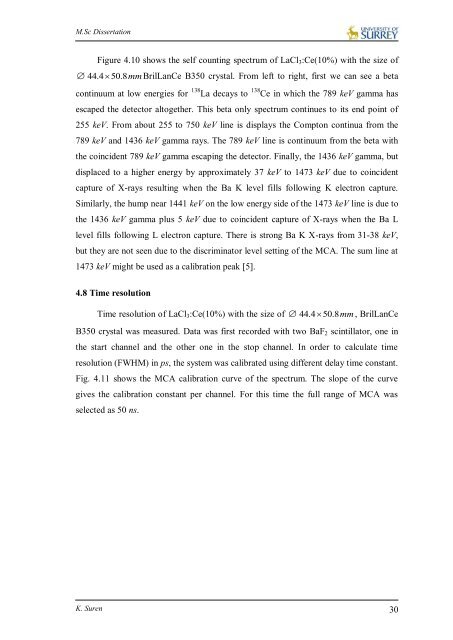
M.Sc <strong>Dissertation</strong>Figure 4.10 shows the self counting spectrum <strong>of</strong> LaCl 3 :Ce(10%) with the size <strong>of</strong> 44.450.8mmBrilLanCe B350 crystal. From left to right, first we can see a betacontinuum at low energies for 138 La decays to 138 Ce in which the 789 keV gamma hasescaped the detector altogether. This beta only spectrum continues to its end point <strong>of</strong>255 keV. From about 255 to 750 keV line is displays the Compton continua from the789 keV and 1436 keV gamma rays. The 789 keV line is continuum from the beta withthe coincident 789 keV gamma escaping the detector. Finally, the 1436 keV gamma, butdisplaced to a higher energy by approximately 37 keV to 1473 keV due to coincidentcapture <strong>of</strong> X-rays resulting when the Ba K level fills following K electron capture.Similarly, the hump near 1441 keV on the low energy side <strong>of</strong> the 1473 keV line is due tothe 1436 keV gamma plus 5 keV due to coincident capture <strong>of</strong> X-rays when the Ba Llevel fills following L electron capture. There is strong Ba K X-rays from 31-38 keV,but they are not seen due to the discriminator level setting <strong>of</strong> the MCA. The sum line at1473 keV might be used as a calibration peak [5].4.8 Time resolutionTime resolution <strong>of</strong> LaCl 3 :Ce(10%) with the size <strong>of</strong> 44.450.8mm, BrilLanCeB350 crystal was measured. Data was first recorded with two BaF 2 scintillator, one inthe start channel and the other one in the stop channel. In order to calculate timeresolution (FWHM) in ps, the system was calibrated using different delay time constant.Fig. 4.11 shows the MCA calibration curve <strong>of</strong> the spectrum. The slope <strong>of</strong> the curvegives the calibration constant per channel. For this time the full range <strong>of</strong> MCA wasselected as 50 ns.K. <strong>Suren</strong> 30