Building the Knowledge Society - Department of Communications ...
Building the Knowledge Society - Department of Communications ...
Building the Knowledge Society - Department of Communications ...

You also want an ePaper? Increase the reach of your titles
YUMPU automatically turns print PDFs into web optimized ePapers that Google loves.
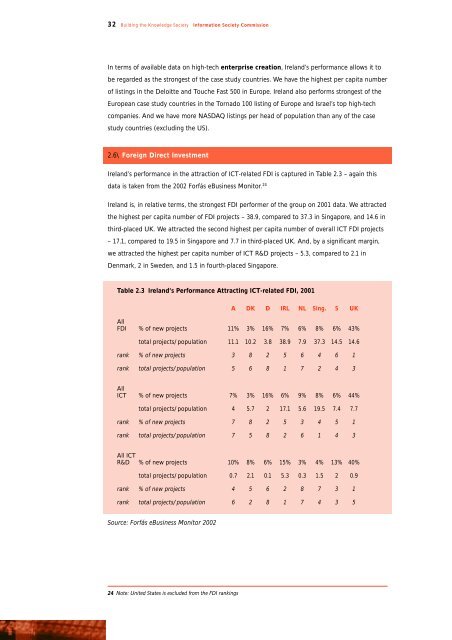
32 <strong>Building</strong> <strong>the</strong> <strong>Knowledge</strong> <strong>Society</strong> Information <strong>Society</strong> CommissionIn terms <strong>of</strong> available data on high-tech enterprise creation, Ireland’s performance allows it tobe regarded as <strong>the</strong> strongest <strong>of</strong> <strong>the</strong> case study countries. We have <strong>the</strong> highest per capita number<strong>of</strong> listings in <strong>the</strong> Deloitte and Touche Fast 500 in Europe. Ireland also performs strongest <strong>of</strong> <strong>the</strong>European case study countries in <strong>the</strong> Tornado 100 listing <strong>of</strong> Europe and Israel’s top high-techcompanies. And we have more NASDAQ listings per head <strong>of</strong> population than any <strong>of</strong> <strong>the</strong> casestudy countries (excluding <strong>the</strong> US).2.6\ Foreign Direct InvestmentIreland’s performance in <strong>the</strong> attraction <strong>of</strong> ICT-related FDI is captured in Table 2.3 – again thisdata is taken from <strong>the</strong> 2002 Forfás eBusiness Monitor. 24Ireland is, in relative terms, <strong>the</strong> strongest FDI performer <strong>of</strong> <strong>the</strong> group on 2001 data. We attracted<strong>the</strong> highest per capita number <strong>of</strong> FDI projects – 38.9, compared to 37.3 in Singapore, and 14.6 inthird-placed UK. We attracted <strong>the</strong> second highest per capita number <strong>of</strong> overall ICT FDI projects– 17.1, compared to 19.5 in Singapore and 7.7 in third-placed UK. And, by a significant margin,we attracted <strong>the</strong> highest per capita number <strong>of</strong> ICT R&D projects – 5.3, compared to 2.1 inDenmark, 2 in Sweden, and 1.5 in fourth-placed Singapore.Table 2.3 Ireland’s Performance Attracting ICT-related FDI, 2001A DK D IRL NL Sing. S UKAllFDI % <strong>of</strong> new projects 11% 3% 16% 7% 6% 8% 6% 43%total projects/population 11.1 10.2 3.8 38.9 7.9 37.3 14.5 14.6rank % <strong>of</strong> new projects 3 8 2 5 6 4 6 1rank total projects/population 5 6 8 1 7 2 4 3AllICT % <strong>of</strong> new projects 7% 3% 16% 6% 9% 8% 6% 44%total projects/population 4 5.7 2 17.1 5.6 19.5 7.4 7.7rank % <strong>of</strong> new projects 7 8 2 5 3 4 5 1rank total projects/population 7 5 8 2 6 1 4 3All ICTR&D % <strong>of</strong> new projects 10% 8% 6% 15% 3% 4% 13% 40%total projects/population 0.7 2.1 0.1 5.3 0.3 1.5 2 0.9rank % <strong>of</strong> new projects 4 5 6 2 8 7 3 1rank total projects/population 6 2 8 1 7 4 3 5Source: Forfás eBusiness Monitor 200224 Note: United States is excluded from <strong>the</strong> FDI rankings