View - ResearchGate
View - ResearchGate
View - ResearchGate

You also want an ePaper? Increase the reach of your titles
YUMPU automatically turns print PDFs into web optimized ePapers that Google loves.
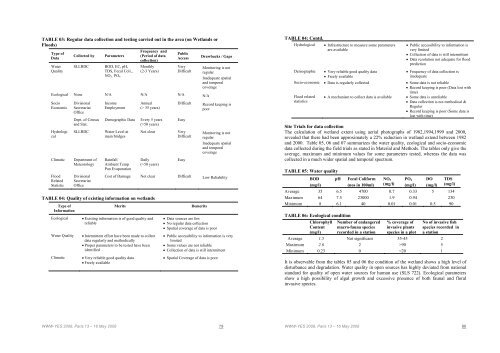
TABLE 03: Regular data collection and testing carried out in the area (on Wetlands orFloods)Type ofDataWaterQualityCollected bySLLRDCParametersBOD, EC, pH,TDS, Fecal Coli.,NO 3, PO 4Frequency and(Period of datacollection)Monthly(2-3 Years)PublicAccessVeryDifficultEcological None N/A N/A N/A N/ASocioEconomicHydrologicalClimaticFloodRelatedStatisticDivisionalSecretariatOfficeDept. of Censusand Stat.SLLRDCDepartment ofMeteorologyDivisionalSecretariatOfficeIncomeEmploymentDemographic DataWater Level atmain bridgesRainfallAmbient TempPan EvaporationAnnual(> 35 years)Every 5 years(>50 years)Not clearDaily(>50 years)TABLE 04: Quality of existing information on wetlandsType ofInformationEcologicalWater QualityClimaticDifficultEasyVeryDifficultEasyDrawbacks / GapsMonitoring is notregularInadequate spatialand temporalcoverageRecord keeping ispoorMonitoring is notregularInadequate spatialand temporalcoverageCost of Damage Not clear Difficult Low ReliabilityMerits Existing information is of good quality andreliable Intermittent effort have been made to collectdata regularly and methodically Proper parameters to be tested have beenidentified Very reliable good quality data Freely availableDemerits Data sources are few No regular data collection Spatial coverage of data is poor Public accessibility to information is verylimited Some values are not reliable Collection of data is still intermittent Spatial Coverage of data is poorTABLE 04: Contd.HydrologicalDemographic Infrastructure to measure some parametersare available Very reliable good quality data Freely available Public accessibility to information isvery limited Collection of data is still intermittent Data resolution not adequate for floodprediction Frequency of data collection isinadequateSocio-economic Data is regularly collected Some data is not reliable Record keeping is poor (Data lost withtime)Flood relatedstatistics A mechanism to collect data is available Some data is unreliable Data collection is not methodical &Regular Record keeping is poor (Some data islost with time)Site Trials for data collectionThe calculation of wetland extent using aerial photographs of 1982,1994,1999 and 2000,revealed that there had been approximately a 22% reduction in wetland extend between 1982and 2000. Table 05, 06 and 07 summarizes the water quality, ecological and socio-economicdata collected during the field trials as stated in Material and Methods. The tables only give theaverage, maximum and minimum values for some parameters tested, whereas the data wascollected in a much wider spatial and temporal spectrum.TABLE 05: Water qualityBOD pH(mg/l)Fecal Coliform(nos in 100ml)NO 3(mg/l)PO 4(mg/l)DO(mg/l)TDS(mg/l)Average 35 6.5 4700 0.7 0.33 5 134Maximum 64 7.5 23000 1.9 0.94 230Minimum 8 6.1 40 0.01 0.01 0.5 90TABLE 06: Ecological conditionChlorophyllContent(mg/l)Number of endangeredmacro-fauna speciesrecorded in a station% coverage ofinvasive plantsspecies in a plotNo of invasive fishspecies recorded ina stationAverage 1.5 Not significant 55-45 2Maximum 2.6 2 >90 5Minimum 0.23 0
![[pastel-00730831, v1] Incidence des pratiques d'entretien ... - LEESU](https://img.yumpu.com/50938896/1/184x260/pastel-00730831-v1-incidence-des-pratiques-dentretien-leesu.jpg?quality=85)