View - ResearchGate
View - ResearchGate
View - ResearchGate

Create successful ePaper yourself
Turn your PDF publications into a flip-book with our unique Google optimized e-Paper software.
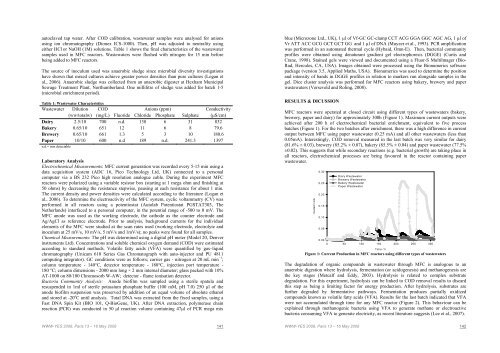
autoclaved tap water. After COD calibration, wastewater samples were analysed for anionsusing ion chromatography (Dionex ICS-1000). Then, pH was adjusted to neutrality usingeither HCl or NaOH (1M) solutions. Table 1 shows the final characteristics of the wastewatersamples used in MFC reactors. Wastewaters were flushed with nitrogen for 15 min beforebeing added to MFC reactors.The source of inoculum used was anaerobic sludge since microbial diversity investigationshave shown that mixed cultures achieve greater power densities than pure cultures (Logan etal., 2006). Anaerobic sludge was collected from an anaerobic digester at Hexham MunicipalSewage Treatment Plant, Northumberland. One millilitre of sludge was added for batch 1-5(microbial enrichment period).Table 1: Wastewater CharacteristicsWastewater Dilution COD Anions (ppm) Conductivity(ww/totalw) (mg/L) Fluoride Chloride Phosphate Sulphate (S/cm)Dairy 2.5/10 700 n.d. 138 6 31 832Bakery 0.65/10 651 12 11 6 8 79.6Brewery 0.65/10 661 1.3 5 3 10 180.6Paper 10/10 600 n.d 189 n.d. 241.3 1397n.d.= non detectableLaboratory AnalysisElectrochemical Measurements: MFC current generation was recorded every 5-15 min using adata acquisition system (ADC 16, Pico Technology Ltd, UK) connected to a personalcomputer via a BS 232 Pico high resolution analogue cable. During the experiment MFCreactors were polarized using a variable resistor box (starting at 1 mega ohm and finishing at50 ohms) by decreasing the resistance stepwise, pausing at each resistance for about 1 min.The current density and power densities were calculated according to the literature (Logan etal., 2006). To determine the electroactivity of the MFC system, cyclic voltammetry (CV) wasperformed in all reactors using a potentiostat (Autolab Potentiostat PGSTAT303, TheNetherlands) interfaced to a personal computer, in the potential range of -500 to 0 mV. TheMFC anode was used as the working electrode, the cathode as the counter electrode andAg/AgCl as reference electrode. Prior to analysis, background currents for the individualelements of the MFC were studied at the scan rates used (working electrode, electrolyte andinoculum at 25 mV/s, 10 mV/s, 5 mV/s and 1mV/s); no peaks were found for all samples.Chemical Measurements: The pH was determined using a digital pH meter (Model 20, Denverinstruments Ltd). Concentrations and soluble chemical oxygen demand (COD) were estimatedaccording to standard methods. Volatile fatty acids (VFA) were quantified by gas–liquidchromatography (Unicam 610 Series Gas Chromatograph with auto-injector and PU 4811computing integrator). GC conditions were as follows; carrier gas - nitrogen at 20 mL min 1 ;column temperature - 140°C, detector temperature - 180°C, injection port temperature -180 °C; column dimensions - 2000 mm long × 2 mm internal diameter; glass packed with 10%AT-1000 on 80/100 Chromosorb W-AW; detector - flame ionisation detector.Bacteria Community Analysis: Anode biofilm was sampled using a sterile spatula andresuspended in 1ml of sterile potassium phosphate buffer (100 mM, pH 7.0) 250 μl of theanode biofilm suspension was preserved by addition of an equal volume of absolute ethanoland stored at -20 o C until analysis. Total DNA was extracted from the fixed samples, using aFast DNA Spin Kit (BIO 101, Q-BioGene, UK). After DNA extraction, polymerase chainreaction (PCR) was conducted in 50 l reaction volume containing 47μl of PCR mega mixblue (Microzone Ltd., UK), 1 μl of Vf-GC GC-clamp CCT ACG GGA GGC AGC AG, 1 μl ofVr ATT ACC GCG GCT GCT GG and 1 μl of DNA (Muyzer et al., 1993). PCR amplificationwas performed in an automated thermal cycle (Hybaid, Omn-E). Then, bacterial communityprofiles were obtained using denaturant gradient gel electrophoresis (DGGE) (Curtis andCrane, 1998). Stained gels were viewed and documented using a Fluor-S Multilmager (Bio-Rad, Hercules, CA, USA). Images obtained were processed using the Bionumerics softwarepackage (version 3.5, Applied Maths, USA). Bionumerics was used to determine the positionand intensity of bands in DGGE profiles in relation to markers run alongside samples in thegel. Dice cluster analysis was performed for MFC reactors using bakery, brewery and paperwastewaters (Verseveld and Roling, 2008).RESULTS & DICUSSIONMFC reactors were operated at closed circuit using different types of wastewaters (bakery,brewery, paper and dairy) for approximately 300h (Figure 1). Maximum current outputs wereachieved after 200 h of electrochemical bacterial enrichment, equivalent to five processbatches (Figure 1). For the two batches after enrichment, there was a high difference in currentoutput between MFC using paper wastewater (0.25 mA) and all other wastewaters (less than0.05mA). Interestingly, COD removal measured in the last batch was very similar for dairy(81.6% ± 0.03), brewery (85.2% ± 0.07), bakery (85.5% ± 0.04) and paper wastewater (77.5%±0.02). This suggests that while secondary reactions (e.g. bacterial growth) are taking place inall reactors, electrochemical processes are being favoured in the reactor containing paperwastewater.Current / mA0.300.250.200.150.100.05Diary WastewaterBrewery WastewaterBakery WastewaterPaper Wastewater0.000 50 100 150 200 250 300Time / hFigure 1: Current Production in MFC reactors using different types of wastewatersThe degradation of organic compounds in wastewater through MFC is analogous to ananaerobic digestion where hydrolysis, fermentation (or acidogenesis) and methanogenesis arethe key stages (Metcalf and Eddy, 2003). Hydrolysis is related to complex substratedegradation. For this experiment, hydrolysis can be linked to COD removal results to discardthis step as being a limiting factor for energy production. After hydrolysis, substrates arefurther degraded by fermentative pathways. Fermentation produces partially oxidizedcompounds known as volatile fatty acids (VFA). Results for the last batch indicated that VFAwere not accumulated through time for any MFC reactor (Figure 2). This behaviour can beexplained through methanogenic bacteria using VFA to generate methane or electroactivebacteria consuming VFA to generate electricity, as recent literature suggests (Lee et al., 2007).WWW-YES 2008, Paris 13 – 16 May 2008 141WWW-YES 2008, Paris 13 – 16 May 2008 142
![[pastel-00730831, v1] Incidence des pratiques d'entretien ... - LEESU](https://img.yumpu.com/50938896/1/184x260/pastel-00730831-v1-incidence-des-pratiques-dentretien-leesu.jpg?quality=85)