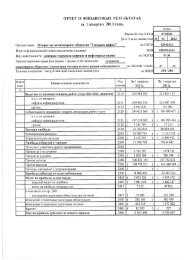
PER<strong>FOR</strong>MANCE ANDFINANCIAL INDICATORSEnergy for life<strong>ENERGY</strong> <strong>FOR</strong> <strong>PEOPLE</strong>CHEVRON ITALIA S.P.A. BRANDIN BARI (ITALY)<strong>JSC</strong> <strong>Gazprom</strong> <strong>Neft</strong> acquired 100% ofoils and lubricants producing facility inBari (Italy) from Chevron Global Energy.The facility’s productive capacityincludes 30 thousand tonnes of oilsand 6 thousand tonnes of lubricantsannually. The production range includes150 types of oils used in cars andcommercial transport as well as oilsmeant for industrial use. Productioncapacity also allows for production of25 different special high-technologylubricants used particularly in the courseof drilling operations. In accordancewith technological agreement, ChevronGlobal Energy has provided a licenseon technical data as well as patentrights for 2 years on “Texaco” brand inItaly to LLC <strong>Gazprom</strong> <strong>Neft</strong> – Lubricants.Products manufactured at the facilityunder “<strong>Gazprom</strong> neft” trade mark will bedistributed both in Italian and Russianmarkets.2008/2007TomskneftIn December 2007 the Companyacquired a 50% equity interest inTomskneft and its subsidiaries froma subsidiary of O<strong>JSC</strong> Oil CompanyRosneft for US$ 3,567 million. As partof this transaction, the Company andRosneft agreed to jointly manage thebusiness operations of Tomskneft andpurchase their respective share ofTomskneft’s annual production.Main MacroeconomicFactors AffectingResults of OperationsThe main factors affecting theCompany’s results of operationsinclude:AAChanges in market prices of crude oiland petroleum products;AARussian Ruble (“RR”) exchange rateversus the US Dollar (“USD”) andInflation;AATaxation;AAChanges in transportation tariffs ofcrude oil and petroleum productsChanges in MarketPrices of CrudeOil and PetroleumProductsThe prices for crude oil and petroleumproducts in the international andRussian markets are the primary factoraffecting the Company’s results ofoperations. In 2009 average Brentcrude oil price plummeted by 36.6%to $61.67 per barrel from $97.26 barrela year ago.At the same time within the course of2009 Brent crude oil price has beensteadily increasing from its minimalvalues in the beginning of the year($39 per barrel on February 18) to$80 per barrel on December 1. In2009 Brent crude price averaged at$61.67 per barrel and as of year endit stood at $77.67 per barrel. Growingcrude pricing environment in 2009 wasfollowing recovery on global marketsfueled by massive liquidity injectionsprovided by world largest centralbanks as well as other measures bygovernments. Crude prices were alsosupported by the reduced supply flowsfrom OPEC members effective fromJanuary 1, 2009.The following table provides informationon average crude oil and petroleumproducts prices in the international anddomestic markets during the periodsanalyzed:The following chart containsinformation about average prices for oiland petroleum products on internationaland domestic markets over the periodsunder analysis:Change, %2009 2008 2007 2009–2008 2008–2007International marketUSD per barrelBrent 61,67 97,26 72,34 (36,6) 34,4Urals Spot (average Med. + NWE) 61,22 94,79 69,23 (35,4) 36,9USD per tonPremium gasoline (average NWE) 578,99 841,55 697,41 (31,2) 20,7Naphtha (average Med. + NWE) 527,28 779,84 662,27 (32,4) 17,8Diesel fuel (average NWE) 536,98 948,49 667,70 (43,4) 42,1Gasoil 0.2% (average Med. + NWE) 512,67 903,81 640,69 (43,3) 41,1Fuel oil 3.5% (average NWE) 341,66 452,55 330,76 (24,5) 36,8Domestic marketUSD per tonHigh-octane gasoline 600,06 1 023,15 835,47 (41,4) 22,5Low-octane gasoline 494,07 803,38 656,82 (38,5) 22,3Diesel fuel 419,88 880,67 617,92 (52,3) 42,5Fuel oil 204,38 329,05 219,45 (37,9) 49,9Source: Platts (international market) and Kortes (domestic market)72
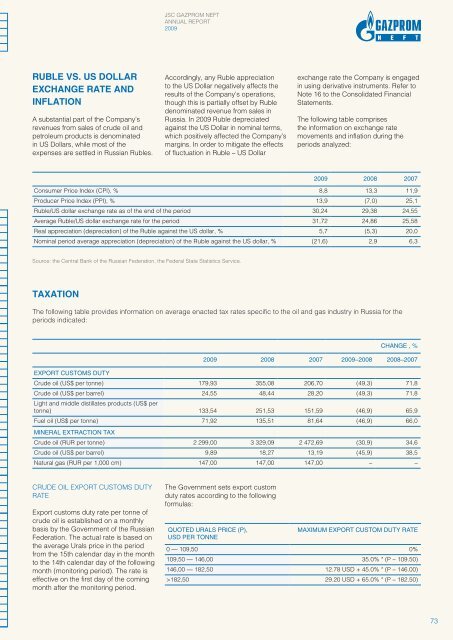
<strong>JSC</strong> GAZPROM NEFTANNUAL REPORT2009Ruble vs. US DollarExchange Rate andInflationA substantial part of the Company’srevenues from sales of crude oil andpetroleum products is denominatedin US Dollars, while most of theexpenses are settled in Russian Rubles.Accordingly, any Ruble appreciationto the US Dollar negatively affects theresults of the Company’s operations,though this is partially offset by Rubledenominated revenue from sales inRussia. In 2009 Ruble depreciatedagainst the US Dollar in nominal terms,which positively affected the Company’smargins. In order to mitigate the effectsof fluctuation in Ruble – US Dollarexchange rate the Company is engagedin using derivative instruments. Refer toNote 16 to the Consolidated FinancialStatements.The following table comprisesthe information on exchange ratemovements and inflation during theperiods analyzed:2009 2008 2007Consumer Price Index (CPI), % 8,8 13,3 11,9Producer Price Index (PPI), % 13,9 (7,0) 25,1Ruble/US dollar exchange rate as of the end of the period 30,24 29,38 24,55Average Ruble/US dollar exchange rate for the period 31,72 24,86 25,58Real appreciation (depreciation) of the Ruble against the US dollar, % 5,7 (5,3) 20,0Nominal period average appreciation (depreciation) of the Ruble against the US dollar, % (21,6) 2,9 6,3Source: the Central Bank of the Russian Federation, the Federal State Statistics Service.TaxationThe following table provides information on average enacted tax rates specific to the oil and gas industry in Russia for theperiods indicated:Change , %2009 2008 2007 2009–2008 2008–2007Export customs dutyCrude oil (US$ per tonne) 179,93 355,08 206,70 (49,3) 71,8Crude oil (US$ per barrel) 24,55 48,44 28,20 (49,3) 71,8Light and middle distillates products (US$ pertonne) 133,54 251,53 151,59 (46,9) 65,9Fuel oil (US$ per tonne) 71,92 135,51 81,64 (46,9) 66,0Mineral extraction taxCrude oil (RUR per tonne) 2 299,00 3 329,09 2 472,69 (30,9) 34,6Crude oil (US$ per barrel) 9,89 18,27 13,19 (45,9) 38,5Natural gas (RUR per 1,000 cm) 147,00 147,00 147,00 – –Crude oil export customs dutyrateExport customs duty rate per tonne ofcrude oil is established on a monthlybasis by the Government of the RussianFederation. The actual rate is based onthe average Urals price in the periodfrom the 15th calendar day in the monthto the 14th calendar day of the followingmonth (monitoring period). The rate iseffective on the first day of the comingmonth after the monitoring period.The Government sets export customduty rates according to the followingformulas:Quoted Urals price (P),USD per tonneMaximum Export Custom Duty Rate0 — 109,50 0%109,50 — 146,00 35.0% * (P – 109.50)146,00 — 182,50 12.78 USD + 45.0% * (P – 146.00)>182,50 29.20 USD + 65.0% * (P – 182.50)73