Modeling and Simulation of Vehicular Power Systems - webfiles its ...
Modeling and Simulation of Vehicular Power Systems - webfiles its ...
Modeling and Simulation of Vehicular Power Systems - webfiles its ...

Create successful ePaper yourself
Turn your PDF publications into a flip-book with our unique Google optimized e-Paper software.
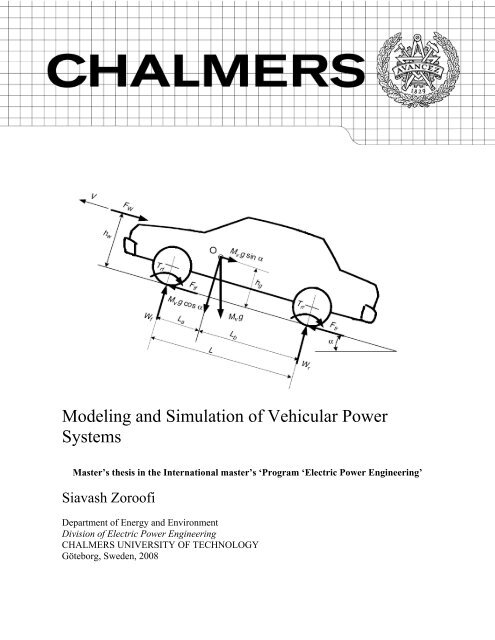
Aha<strong>Modeling</strong> <strong>and</strong> <strong>Simulation</strong> <strong>of</strong> <strong>Vehicular</strong> <strong>Power</strong><strong>Systems</strong>Master’s thesis in the International master’s ‘Program ‘Electric <strong>Power</strong> Engineering’Siavash Zoro<strong>of</strong>iDepartment <strong>of</strong> Energy <strong>and</strong> EnvironmentDivision <strong>of</strong> Electric <strong>Power</strong> EngineeringCHALMERS UNIVERSITY OF TECHNOLOGYGöteborg, Sweden, 2008
Siavash Zoro<strong>of</strong>i© SIAVASH ZOROOFIMaster’s Thesis 2008ISSN 1652-8557Department <strong>of</strong> Energy <strong>and</strong> EnvironmentDivision <strong>of</strong> Electric <strong>Power</strong> EngineeringChalmers University <strong>of</strong> TechnologySE-412 96 GöteborgSwedenTelephone: +46 (0) 31-772 1000
To my parents, brother <strong>and</strong> my love Sara
AbstractRegarding limitation <strong>of</strong> fossil fuels <strong>and</strong> the high consumption rate <strong>of</strong> this energy fortransportation, inclination <strong>of</strong> vehicle industry toward other sources <strong>of</strong> energy isinevitable. Electric vehicles <strong>and</strong> hybrid vehicles could be a good solution. Thanks to thestate <strong>of</strong> art electric motors, power electronics, embedded power train controller, energystorage systems like batteries <strong>and</strong> ultra capacitors, the performance <strong>of</strong> the vehicle couldbecome more <strong>and</strong> more energy efficient. Since the integrating <strong>of</strong> all these components ina drive train configuration could be a challenge for the manufacturer, computersimulation <strong>and</strong> modeling before prototyping could be really beneficial in terms <strong>of</strong> cost,safety <strong>and</strong> design performance. In this thesis some <strong>of</strong> the principles <strong>of</strong> modeling <strong>and</strong>simulation are discussed. The main components in hybrid vehicles are modeled <strong>and</strong>different methods <strong>of</strong> modeling are discussed. As battery plays a significant role in electric<strong>and</strong> hybrid vehicles, modeling <strong>of</strong> it is <strong>of</strong> importance. In this thesis some <strong>of</strong> the methods tomodel Lead-acid <strong>and</strong> Lithium-ion battery are introduced. Some tests in order to find theinternal parameters <strong>of</strong> the battery are explained <strong>and</strong> based on the data from the tests aLithium-ion battery is modeled in Simulink/Matlab. The dynamics <strong>of</strong> the vehicle in terms<strong>of</strong> longitudinal <strong>and</strong> lateral forces are discussed <strong>and</strong> a model representing the phenomenon<strong>of</strong> wheel slip is developed in Simulink. <strong>Modeling</strong> <strong>of</strong> engine <strong>and</strong> electric motors isexplained. Having models in Matlab/Simulink, a series hybrid drive train includingbatteries, motor, generator, vehicle dynamics <strong>and</strong> control system is simulated. Given thedata from the test data from a series hybrid bus manufactured by the New FlyerCompany, the performance <strong>of</strong> the vehicle in terms <strong>of</strong> fuel economy, acceleration <strong>and</strong>maximum cruise speed is analyzed. The behavior <strong>of</strong> different components is alsodiscussed. Finally, comparing the simulation results with test data, it is shown thatmodeling <strong>and</strong> simulation could be really helpful in design process. The battery model wasverified with measurements <strong>and</strong> is proved to have a good accuracy.iv
Table <strong>of</strong> ContentsAcknowledgment..........................................................................................iiiSiavash Zoro<strong>of</strong>i ............................................................................................iiiMarch 2008, Goteborg, Sweden .................................................................iiiAbstract......................................................................................................... ivTable <strong>of</strong> Contents .......................................................................................... vList <strong>of</strong> Tables ................................................................................................ ixList <strong>of</strong> Symbols .............................................................................................. x1 Introduction............................................................................................ 11.1 Objective <strong>of</strong> the thesis......................................................................................... 11.2 Thesis outline...................................................................................................... 12 Background............................................................................................. 32.1 Hybrid Electric Vehicles..................................................................................... 32.2 Hybrid Vehicles as an Alternative Solution........................................................ 42.3 <strong>Simulation</strong> <strong>of</strong> Hybrid Vehicles ........................................................................... 52.4 Hybrid Vehicles Drive Trains............................................................................. 62.4.1 Series Hybrid Vehicles ............................................................................... 72.4.2 Parallel Hybrid Vehicles............................................................................. 93 <strong>Simulation</strong> <strong>and</strong> <strong>Modeling</strong> Principles.................................................. 113.1 Physics Based <strong>Modeling</strong>................................................................................... 123.2 Numerical Integration Methods ........................................................................ 134 Vehicle Dynamics <strong>Modeling</strong>................................................................ 154.1 Wheel Dynamics <strong>and</strong> Wheel slip...................................................................... 174.1.1 Normal load on each wheel....................................................................... 204.1.2 Friction coefficient <strong>and</strong> slip modeling ...................................................... 204.2 Transmission..................................................................................................... 225 Battery <strong>Modeling</strong> ................................................................................. 245.1 Electrochemical battery models........................................................................ 245.1.1 Peukert equation........................................................................................ 245.1.2 Battery capacity <strong>and</strong> discharge current..................................................... 255.2 Shepherd Model Equation................................................................................. 265.3 Unnewehr Universal Model.............................................................................. 265.4 EQUIVALENT CIRCUIT BATTERY MODELS ........................................... 275.4.1 Thevenin battery model ............................................................................ 275.4.2 Linear dynamic model .............................................................................. 295.4.3 Nonlinear dynamic model......................................................................... 295.5 Thermal modeling <strong>of</strong> the battery....................................................................... 315.6 Parameters measurement .................................................................................. 325.6.1 Open circuit voltage.................................................................................. 325.6.2 Charging <strong>and</strong> Discharging Resistances..................................................... 335.6.3 Capacitor................................................................................................... 355.6.4 Battery capacity ........................................................................................ 366 Engine, electric machine <strong>and</strong> control system modeling ................... 37v
6.1 Electric motors.................................................................................................. 376.2 Internal combustion engine............................................................................... 386.3 Control system .................................................................................................. 407 <strong>Modeling</strong> in Simulink/Matlab............................................................. 417.1 Battery............................................................................................................... 417.1.1 Thermal model.......................................................................................... 427.2 Vehicle dynamics.............................................................................................. 427.2.1 Tyre........................................................................................................... 447.3 Engine ............................................................................................................... 457.4 Electric Motor ................................................................................................... 457.5 Driving Cycles .................................................................................................. 457.6 Automatic Driver .............................................................................................. 467.7 Control <strong>and</strong> energy Management...................................................................... 488 <strong>Simulation</strong> Results ............................................................................... 498.1 Battery simulation results ................................................................................. 498.2 Series hybrid bus simulation............................................................................. 508.3 Acceleration performance................................................................................. 518.4 CBD drive cycle test ......................................................................................... 539 Conclusion............................................................................................. 599.1 Future Work...................................................................................................... 59References.................................................................................................... 61vi
List <strong>of</strong> FiguresFigure 2-1: Oil consumption in the world........................................................................... 3Figure 2-2: Oil consumption per region.............................................................................. 3Figure 2-3: Carbon dioxide emission distribution from 1980 to 1999 ............................... 4Figure 2-4: Generic traction system structure..................................................................... 7Figure 2-5: Functional block diagram <strong>of</strong> a series hybrid vehicle ....................................... 8Figure 2-6: Configuration <strong>of</strong> a series hybrid vehicle.......................................................... 8Figure 2-7: Functional block diagram <strong>of</strong> a parallel hybrid vehicle .................................... 9Figure 2-8: Configuration <strong>of</strong> a parallel hybrid vehicle ..................................................... 10Figure 3-1: RCF modeling................................................................................................ 12Figure 3-2: EMTS solution flow-chart ............................................................................. 14Figure 4-1 Vehicle longitudinal forces ............................................................................. 15Figure 4-2: The deflection <strong>of</strong> tyre <strong>and</strong> rolling resistance.................................................. 16Figure 4-3 Tractive for change with slip <strong>of</strong> tyre............................................................... 18Figure 4-4 Torques <strong>and</strong> forces on the wheel..................................................................... 19Figure 4-5 Friction coefficient change with slip for different road types......................... 21Figure 4-6 Tractive effort <strong>of</strong> internal combustion engine <strong>and</strong> a multi-gear transmissionvehicle vs. vehicle speed................................................................................................... 22Figure 5-1 Peukert curve <strong>and</strong> capacity change <strong>of</strong> battery versus discharge current......... 25Figure 5-2: Battery Thevenin model................................................................................. 28Figure 5-3: Modified Thevenin model.............................................................................. 28Figure 5-4:Battery linear model........................................................................................ 29Figure 5-5: Battery nonlinear model................................................................................. 30Figure 5-6 Battery model updating chart.......................................................................... 31Figure 5-7 Test procedure for measurement <strong>of</strong> open circuit voltage................................ 32Figure 5-8 Battery open circuit voltage versus state <strong>of</strong> charge......................................... 33Figure 5-9 Circuit for determining <strong>of</strong> open circuit voltage............................................... 34Figure 5-10 Discharge resistance versus state <strong>of</strong> charge .................................................. 34Figure 5-11 Charging resistance versus state <strong>of</strong> charge.................................................... 35Figure 5-12 Circuit to determine battery capacitance....................................................... 36Figure 5-13Transient behavior <strong>of</strong> battery terminal voltage during load change .............. 36Figure 6-1 Efficiency map <strong>of</strong> a typical PMSM................................................................. 37Figure 6-2 Dynamic models for PMSM (left) <strong>and</strong> DC motor (right) ............................... 38Figure 6-3 Engine efficiency map..................................................................................... 39Figure 6-4 Engine torque & speed characteristic.............................................................. 39Figure 7-1 Block diagram <strong>of</strong> battery model...................................................................... 42Figure 7-2 Battery thermal model block diagram............................................................. 42Figure 7-3 Vehicle dynamics block in Matlab/Simulink.................................................. 43Figure 7-4 Vehicle dynamic block components ............................................................... 44Figure 7-5 Tyre block in Matlab/Simulink ....................................................................... 44Figure 7-6 City Bus Drive cycle (CBD) ........................................................................... 46Figure 7-7 Automatic driver model block in Matlab/Simulink ........................................ 47Figure 8-1 Battery charging test ....................................................................................... 49Figure 8-2 Battery discharging test................................................................................... 50Figure 8-3 Acceleration test <strong>of</strong> bus................................................................................... 51Figure 8-4 Wheel speed <strong>and</strong> translated actual vehicle speed............................................ 52vii
Figure 8-5 Wheel speed <strong>and</strong> translated actual vehicle speed............................................ 53Figure 8-6 Bus speed ........................................................................................................ 54Figure 8-7 Engine <strong>and</strong> generator power <strong>and</strong> speed curve................................................. 55Figure 8-8 Electric motor torque, speed <strong>and</strong> efficiency.................................................... 56Figure 8-9 Battery state <strong>of</strong> charge change ........................................................................ 57Figure 8-10 Fuel power, fuel consumption <strong>and</strong> average engine efficiency..................... 58viii
List <strong>of</strong> TablesTable 3-1 List <strong>of</strong> some s<strong>of</strong>t wares used in hybrid vehicle simulations............................. 11Table 4-1 Drag coefficient for different body shapes....................................................... 17Table 4-2 Parameters <strong>of</strong> the wheel dynamics equation .................................................... 19Table 4-3 Pacejka coefficients for different road types................................................... 21Table 6-1 Diesel engine specifications ............................................................................. 38Table 8-1 <strong>Simulation</strong> data for series hybrid bus ............................................................... 50Table 8-2 <strong>Simulation</strong> <strong>and</strong> test result for fuel economy..................................................... 58ix
T tW tCT iInSOCt∆tE tE oR iK iqE ocR oK Rpp maxR cR dC 1mC pTR inti(t)h cAT aR loadV ocV bR 1y(t)hGb 1b 2τEngine torqueEngine speedBattery capacityBattery discharging timeCurrentBattery constantState <strong>of</strong> chargeTimeTime stepBattery terminal voltageBattery open circuit voltageBattery internal resistanceBattery polarization resistanceAccumulated battery charge over full chargeBattery open circuit voltageTotal internal resistance <strong>of</strong> a fully charged batteryExperimental constantOut-put powerMaximum out-put powerCharging internal resistanceDischarging internal resistanceBattery capacitanceBattery massBatter heat capacityTemperatureBattery total internal resistanceInstantaneous currentHeat coefficientBattery cooling areaAmbient temperatureLoad resistanceOpen circuit voltageBattery terminal voltageLoad resistance oneOut-put for RCF model in each time<strong>Simulation</strong> time stepJacobian matrixConstant in RCFConstant RCFVoltage time constantxi
xii
1 IntroductionNowadays electric <strong>and</strong> hybrid vehicles are being more <strong>and</strong> more placed in the center <strong>of</strong>attraction because <strong>of</strong> the importance <strong>of</strong> shortage in fossil fuels. As simulation <strong>and</strong>modeling <strong>of</strong> different hybrid <strong>and</strong> electric vehicles plays an important role before thedesign <strong>and</strong> manufacturing process, having a simulation environment which includesdifferent models for components used in drive train could be really beneficial [8].To havea good simulation environment, it is needed to make a library <strong>of</strong> models <strong>of</strong> componentsexist in the drive train <strong>of</strong> vehicles. There are so many simulation programs being used forstudy <strong>and</strong> analysis <strong>of</strong> different drive trains [8], [6]. Different components in the drivetrain <strong>of</strong> hybrid vehicles are modeled with different methods [7], [8], [1], [4].Theimportance <strong>and</strong> benefit <strong>of</strong> having a simulation environment is discussed in [5], [22].In[15] some methods to model internal combustion engines is discussed. In [17], [18], [23],[24], different methods to simulate batteries is given <strong>and</strong> discussed. The energymanagement <strong>and</strong> control strategies used in hybrid drive trains is presented in [14].In [1],[2], [3], [7], [9] some methods for modeling <strong>of</strong> electric machines are given. As the wholedrive train <strong>of</strong> hybrid vehicles is a combination <strong>of</strong> electric <strong>and</strong> mechanical components,the dynamic modeling <strong>of</strong> the vehicle <strong>and</strong> mechanical parts is in the aspect <strong>of</strong> interest. In[4], [8], [10], [11], [12] <strong>and</strong> [13], the dynamics <strong>of</strong> the vehicles <strong>and</strong> how to model it isdiscussed.1.1 Objective <strong>of</strong> the thesisThe purpose <strong>of</strong> this thesis is to provide some tools <strong>and</strong> methods for modeling <strong>and</strong>simulation <strong>of</strong> components used in drive trains <strong>of</strong> hybrid vehicles. A goal is to introduceprinciples <strong>of</strong> simulation <strong>and</strong> the methods used for simulation <strong>of</strong> vehicular power systems.It is desired to create a simulation model for different components used in vehicle drivetrain. Different methods used to model vehicle dynamics, batteries <strong>and</strong> electric motors,engine is given. Altogether making a simulation environment to show the importance <strong>of</strong>modeling <strong>and</strong> simulation <strong>of</strong> vehicular power systems is one <strong>of</strong> the main objectives <strong>of</strong> thisthesis.1.2 Thesis outlineThis thesis is arranged in nine chapters. The first chapter, which constitutes theintroduction, provides the aim <strong>and</strong> scope <strong>of</strong> the thesis <strong>and</strong> what is done to accomplish theaims.Chapter 2 includes some theoretical background <strong>of</strong> hybrid vehicles <strong>and</strong> clarifies theimportance <strong>of</strong> simulation <strong>and</strong> modeling <strong>of</strong> vehicular power systems.Chapter 3 focuses on the basic <strong>and</strong> principles <strong>of</strong> simulation <strong>and</strong> modeling. Somesimulation tools which are used for vehicles simulations <strong>and</strong> comparison <strong>of</strong> them isgiven.1
Chapter 4 discusses the dynamics <strong>of</strong> the vehicle <strong>and</strong> a method to model the dynamicsbehavior <strong>of</strong> vehicles is given.Chapter 5 presents the principles <strong>of</strong> modeling <strong>of</strong> batteries as an important part in electric<strong>and</strong> hybrid vehicles drive train. Some models are introduced <strong>and</strong> compared with eachother. At the end <strong>of</strong> a nonlinear model which can be used for Lithium-ion, Lead-acid <strong>and</strong>Nickel-metal-hydride battery is given.Chapter 6 includes some methods for electric machines <strong>and</strong> engine modeling. At the end,the energy management <strong>and</strong> control system is discussed.Chapter 7 focuses on the modeling blocks <strong>of</strong> different components in the drive train <strong>of</strong>hybrid vehicles <strong>and</strong> shows how to create the models in Matlab/Simulink.In Chapter 8 a typical drive train <strong>of</strong> a series hybrid bus is made <strong>and</strong> the performance <strong>of</strong>the simulation model is analyzed.Finally in chapter 9 the overall conclusions <strong>of</strong> thesis work are given <strong>and</strong> it outlines somefuture work.2
2 Background2.1 Hybrid Electric VehiclesThe increase <strong>of</strong> depletion <strong>of</strong> fossil fuels for multiple purposes like generation <strong>of</strong> otherforms <strong>of</strong> energy (electricity, heating <strong>and</strong> transportation) is growing. This growth is muchfaster than the time it takes to aggregate the energy stored in new oil <strong>and</strong> coal, so newsolutions for finding other energy sources is needed.Oil consumption in thous<strong>and</strong>barrels per day90,00080,00070,00060,00050,00040,00030,00020,00010,00001980198219841986198819901992199419961998200020022004YearFigure 2-1: Oil consumption in the worldNorth America South <strong>and</strong> Central America Europe Euroasia Middle East Africa Asia <strong>and</strong> Oceaniaoil consumption in thous<strong>and</strong> barrels perday3000025000200001500010000500001980198219841986198819901992199419961998200020022004YearFigure 2-2: Oil consumption per region3
The Other environmental effects <strong>of</strong> the usage <strong>of</strong> fossil sources are really going to becomea serious problem in the near future. Air pollution <strong>and</strong> global warming are two <strong>of</strong> themost important ones [11]. Most <strong>of</strong> the conventional vehicles use internal combustionengines (ICE) in which the fuel reacts with oxygen <strong>and</strong> produces heat, some gases (CO 2,CO, HC <strong>and</strong> NO x ) <strong>and</strong> mechanical power. The combustion <strong>of</strong> hydrocarbon fuel incombustion engines is never ideal so some other gases are produced after the reactionbesides carbon dioxide <strong>and</strong> water. The combustion products contain a certain amount <strong>of</strong>nitrogen oxides (NOx), carbon monoxides (CO), <strong>and</strong> unburned hydrocarbons (HC), all <strong>of</strong>which are toxic to human health. The carbon dioxide <strong>and</strong> other green house gases likemethane play a significant role in global warming. These gases trap the Sun’s infraredradiation reflected by the ground, thus retaining the energy in the atmosphere <strong>and</strong>increasing the temperature [11]. An increased earth temperature results in majorecological damages to <strong>its</strong> ecosystems <strong>and</strong> in many natural disasters that affect humanpopulations.The part <strong>of</strong> transportation effect on global warming <strong>and</strong> air pollution is indicated in figure2-3.Figure 2-3: Carbon dioxide emission distribution from 1980 to 19992.2 Hybrid Vehicles as an Alternative SolutionBased on the reasons mentioned above <strong>and</strong> as the transportation has a major role in dailylife, finding <strong>of</strong> sustainable fuel energy with the lowest emission is highly desirable whichfor transportation, it means:a) There is a need to reduce emissions related to transportation.b) There is a need to base transportation operating on renewable fuels.4
Hybrid vehicles <strong>and</strong> fuel cells can be one <strong>of</strong> the solutions. The advancement in thetechnology <strong>of</strong> power electronics, electric machines <strong>and</strong> the usage <strong>of</strong> different controlmethods the vehicle is able to:• Recapturing the regenerative breaking energy• Having more efficient operating points for the combustion engine• Eliminating <strong>of</strong> engine idling time• Using <strong>of</strong> different control <strong>and</strong> energy management algorithmsThe above abilities have caused the following benef<strong>its</strong> <strong>of</strong> hybrid vehicles:• Decrease fuel consumption• Decrease emissions• Increase the life cycle <strong>of</strong> mechanical parts• Increase total efficiencyThe hybrid vehicle (HV) can be a cost effective way to improve fuel economy, reduceemissions, <strong>and</strong> still maintain customer dem<strong>and</strong>s <strong>of</strong> performance, comfort, <strong>and</strong> cost.2.3 <strong>Simulation</strong> <strong>of</strong> Hybrid VehiclesIn a comparison between conventional <strong>and</strong> hybrid electric vehicles drive trains, it is seenthat the role <strong>of</strong> electric components like electric machines, power electronic converters<strong>and</strong> embedded power train controllers is really significant. There are so many state <strong>of</strong> theart energy storage components like batteries, super capacitors. Vehicles also use moderninternal combustion engine <strong>and</strong> mechanical components.In each design process <strong>of</strong> hybrid <strong>and</strong> electric vehicles, all the components in the drivetrain should be chosen, rated <strong>and</strong> controlled in such a way that the whole design isoptimized for getting the best performance in terms <strong>of</strong> cost <strong>and</strong> fuel consumption <strong>and</strong>reliability. To achieve this goal having a simulation environment with the model <strong>of</strong> eachcomponent representing the real behavior <strong>of</strong> it could help to get to better design <strong>and</strong> savemoney.<strong>Modeling</strong> <strong>and</strong> simulation are indispensable for concept evaluation, prototyping, <strong>and</strong>analysis <strong>of</strong> hybrid vehicles. This is particularly true when novel hybrid power trainconfigurations <strong>and</strong> controllers are developed. [8]Computer simulation has long been an essential way, <strong>and</strong> <strong>of</strong> major significance, in thedesign process <strong>of</strong> modern industrial systems. Computer simulation can be used to reducethe expense <strong>and</strong> length <strong>of</strong> a design cycle <strong>of</strong> hybrid vehicles by testing configurations <strong>and</strong>energy management systems before prototype construction begins [8]. It also provides areliable alternative in situations where the studies or tests to be performed are dangerous<strong>and</strong> expensive (crash test <strong>of</strong> a vehicle), or strategically unfavorable (short-circuit test on apower transmission line) [6]. Further more the complexity <strong>of</strong> sophisticated new powertrains dependence on different control strategy is also a concern in automotive research.5
So a modeling tool being able to design not only drive train components but alsoembedded control s<strong>of</strong>tware is needed.2.4 Hybrid Vehicles Drive TrainsAs the name expresses, hybrid vehicles get benefit <strong>of</strong> minimum two energy sources. Thedem<strong>and</strong>ed power for traction <strong>and</strong> other auxiliary loads in the vehicle is shared betweentwo sources <strong>of</strong> energy with a specific power sharing management. The main parts <strong>of</strong> eachhybrid vehicle could be classified as:• Primary energy storage system• Secondary energy storage system• Primary energy converter• Secondary energy converter• Control system• TransmissionIn figure 2.4 examples <strong>of</strong> energy storage systems <strong>and</strong> different energy conversion un<strong>its</strong>are shown.6
Figure 2-4: Generic traction system structureThere are different topologies <strong>of</strong> hybrid vehicles but series <strong>and</strong> parallel topologies are themost commonly used ones [9]. Hybrid electric systems can be broadly classified as seriesor parallel hybrid systems [4], [5]. In series hybrid systems, all the torque required topropel the vehicle is provided by an electric motor. On the other h<strong>and</strong>, in parallel hybridsystems, the torque obtained from the heat engine is mechanically coupled to the torqueproduced by an electric motor. In an electric vehicle, the electric motor behaves exactlyin the same manner as in a series hybrid. Therefore, the torque <strong>and</strong> power requirements <strong>of</strong>the electric motor are roughly equal for an electric vehicle <strong>and</strong> a series hybrid, while theyare lower for a parallel hybrid [8].Each topology has <strong>its</strong> own drive train <strong>and</strong> components. It also has <strong>its</strong> own advantages<strong>and</strong> disadvantages <strong>and</strong> uses different control strategies. In the following, the principle <strong>and</strong>main components <strong>of</strong> each topology will be explained.2.4.1 Series Hybrid VehiclesIn this topology the primary energy converter is the internal combustion engine (ICE)which has been connected to an electric motor working as a generator. The out-put <strong>of</strong> thegenerator through power electronic converters is connected to the secondary energystorage which is a battery. The battery via power electronic converters is connected to an7
electric motor to provide the tractive force on the wheels <strong>of</strong> the vehicle through thetransmission system [11]. The series configuration is shown in figure 2-5 <strong>and</strong> 2-6.Figure 2-5: Functional block diagram <strong>of</strong> a series hybrid vehicleFigure 2-6: Configuration <strong>of</strong> a series hybrid vehicleAs the internal combustion engine is not connected directly to the transmission system soit can be run at the best efficiency operation points which consequently results in less fuelconsumption.In series hybrid vehicles the traction power must be transferred to the wheels through thetraction motor. The cost <strong>and</strong> weight <strong>of</strong> the traction motor in order to provide the needed8
power during acceleration <strong>and</strong> regenerative energy is a constraint in this type <strong>of</strong> hybridvehicle [11].2.4.2 Parallel Hybrid VehiclesIn this topology, figure 2-7 <strong>and</strong> 2-8, the main energy source <strong>and</strong> the secondary energysource are connected in parallel to the transmission system. It means that both the internalcombustion engine <strong>and</strong> the traction motor apply a torque to the shaft <strong>of</strong> the transmissionsystem. In this configuration the combustion engine is responsible to provide the tractionpower <strong>and</strong> the power needed to keep the battery charged. The performance <strong>and</strong> fueleconomy <strong>of</strong> the vehicles depend heavily on the applied energy management strategy.There are many energy management strategies used to improve the fuel economy <strong>of</strong> thevehicle [14]. One strategy is “on/<strong>of</strong>f” or “Thermostat”. Under this strategy the engine willturn on <strong>and</strong> <strong>of</strong>f based on the SOC status <strong>of</strong> the battery. There is another strategy called“power split”. Under this “<strong>Power</strong> Split” strategy the engine <strong>and</strong> the battery operate at thehigh efficient operating points. These operating points are selected based on theefficiency maps <strong>of</strong> the components. As the combustion engine is responsible to providemost <strong>of</strong> the traction power <strong>and</strong> also keep the state <strong>of</strong> charge <strong>of</strong> the battery (usually 65%)so the power rating <strong>of</strong> the ICE is higher than that <strong>of</strong> electric traction motor [14].Figure 2-7: Functional block diagram <strong>of</strong> a parallel hybrid vehicle9
Figure 2-8: Configuration <strong>of</strong> a parallel hybrid vehicle10
3 <strong>Simulation</strong> <strong>and</strong> <strong>Modeling</strong> PrinciplesDepending on the level <strong>of</strong> detailness required for the simulation, each component ismodeled. The modeling is classified into steady-state, quasi-state <strong>and</strong> dynamic models.The steady-state <strong>and</strong> quasi-state models are to do long –term analysis over extended drivecycles. These models are helpful during the design stage when architectural decisions <strong>and</strong>high-level operating strategies need to be evaluated. The advantage <strong>of</strong> this modeling isfast computation while the disadvantage is inaccuracy for dynamic simulation. [15], [8].Dynamic models based on physics <strong>of</strong> the components are needed to make lower-levelcomparisons among subsystems <strong>and</strong> support subsystem design. The dynamic models relyon differential equations <strong>of</strong> the component <strong>and</strong> depending on how well the physicalsystem is represented; they show a good accuracy in simulation. In order to have anaccurate design for hybrid vehicles <strong>and</strong> find the power rating <strong>of</strong> each component the use<strong>of</strong> dynamic models is beneficial. <strong>Power</strong> electronic devices which play an important rolein hybrid vehicles are working with high switching frequencies. The estimation <strong>of</strong> thepeak rating <strong>of</strong> them in a vehicular operation system is thus essential.This can be over come by dynamic modeling which gives more accurate results thansteady state models. To calculate the total efficiency <strong>of</strong> the drive train <strong>and</strong> consequentlygetting ratings <strong>of</strong> components, estimate <strong>of</strong> conduction <strong>and</strong> switching losses in powerelectronic converters is another point which can be simulated by using dynamic models[15].In Table 3.1 a list <strong>of</strong> some s<strong>of</strong>t wares which are used for simulation <strong>of</strong> vehicular powersystems is shown.Table 3-1 List <strong>of</strong> some s<strong>of</strong>t wares used in hybrid vehicle simulationsType <strong>of</strong><strong>Modeling</strong>Name <strong>of</strong> S<strong>of</strong>twareSteady-StateDynamicPSATSimplorerSIMPLEVSaberADVISORDymolaMARVELV-ElphJANUSPSIMPSATPSCAD- VTB- Simulink11
Vehicle system modeling can be done for different aspects <strong>of</strong> interest: <strong>Modeling</strong> forperformance evaluation (acceleration, grade ability <strong>and</strong> maximum speed); <strong>Modeling</strong> forprediction, evaluation <strong>and</strong> optimization <strong>of</strong> the fuel consumption; <strong>Modeling</strong> for emissiondetermination; modeling for cost <strong>and</strong> packaging <strong>and</strong> different other interests. Accordingto the details <strong>of</strong> modeling, the models can become more <strong>and</strong> more complicated <strong>and</strong>sophisticated. As much as the model becomes complicated, the run time <strong>of</strong> the simulationincreases. There is a trade –<strong>of</strong>f between model detail <strong>and</strong> run time [8], [15], [5].3.1 Physics Based <strong>Modeling</strong>For detailed dynamic modeling <strong>and</strong> simulation <strong>of</strong> hybrid vehicles, physic-based modelingis needed. The dynamic equations <strong>of</strong> the system are based on physical laws <strong>of</strong> the system.A series <strong>of</strong> dynamic equations governing the physical principles <strong>of</strong> the components aremade. These equations are comprised <strong>of</strong> the state <strong>of</strong> some system’s physical parameters,physical constants <strong>and</strong> variables. Resistive Companion modeling technique, RCF, is one<strong>of</strong> the physics based techniques by which it is possible to get a physics-based model <strong>of</strong>each component in a modular format [8]. Although this method originates from electricalengineering but it can be used for multidisciplinary modeling applications such as hybridpower train <strong>and</strong> power systems. Using this sort <strong>of</strong> modular modeling <strong>of</strong> each component,shown in figure 3-1, there is the possibility <strong>of</strong> connecting several modules <strong>and</strong> do thesimulations. In this technique each component is considered as a black box having someterminals to be connected to other modules.Component Block boxFigure 3-1: RCF modelingEach terminal has two variables, cross (v 1 ) <strong>and</strong> through (I 1 ) [8]. If the terminals areelectrical, one is voltage to a reference point <strong>and</strong> the other is current going into theterminal as shown in figure 3-1.The physical dynamic equations <strong>of</strong> the system are written based on “State Space“equations. Generally each component is modeled by the dynamic equations describingthe physical dynamics <strong>of</strong> the components, (3-1) shows the general equation used for RCFmodeling:12
⎡ I ( t ) ⎤⎢ ⎥ =⎣0⎦⎡v( t ) ⎤× ⎢ ⎥⎣ y ( t ) ⎦G[ v ( t ), v ( t − h ), I ( t ), I ( t − h ), y ( t ), y ( t − h ), t ]⎡b1− ⎢⎣b2[ v ( t ), v ( t − h ), I ( t ), I ( t − h ), y ( t ), y ( t − h ), t ][ ] ⎥ ⎤v ( t ), v ( t − h ), i ( t ), i ( t − h ), y ( t ), y ( t − h ), t ⎦( 3-1)where I is a vector <strong>of</strong> through variables, V is a vector <strong>of</strong> across variables, h is time step <strong>of</strong>the simulation is a vector <strong>of</strong> state variables, G is Jacobin matrix <strong>and</strong> b 1 <strong>and</strong> b 2 areconstants depending generally on past history values <strong>of</strong> through, across variables <strong>and</strong>internal states <strong>and</strong> values <strong>of</strong> these quantities at time instant. The full description <strong>of</strong> RCF<strong>and</strong> the modeling <strong>of</strong> some components like DC machines, DC/DC converters <strong>and</strong> vehicledynamics were given in [8].Once all the components are modeled <strong>and</strong> connected to each other according to theexisting constraints between the modules, the equations could be solved by numericalintegration methods, (rectangular, trapezoidal, second order Gears method) <strong>and</strong> the statevariables are found in each time step.3.2 Numerical Integration MethodsAs the state space dynamic equations are solved by numerical integrations there arenumerical integration methods available to solve the dynamic equations. Some numericalintegration methods like, the rectangular, the trapezoidal, Simpson’s, Rounge Kutta’s,Gear’s, backward Euler’s can be found in [6], [8].Among the mentioned methods, the trapezoidal <strong>and</strong> rectangular methods are commonlyused. In some transient simulation programs like EMTS( Electromagnetic Transient<strong>Simulation</strong>), the trapezoidal methods are used because <strong>of</strong> their mer<strong>its</strong> <strong>of</strong> low distortion<strong>and</strong> absolute-stability [8]. Most <strong>of</strong> the transient simulation programs follow up the chartshown in figure 3-2 to converge to the final result.13
Figure 3-2: EMTS solution flow-chartAlthough these methods are really accurate, there will still be some numerical oscillationsespecially when the power electronic converters with high switching frequencies are usedin the simulation. In order to get to high accuracy these numerical oscillations must beconsidered [8].In order to mitigate these oscillations there are two techniques: using the trapezoidaltechnique with numerical stabilizer <strong>and</strong> using Gear’s second order method. In [8] thesemethods are explained.14
4 Vehicle Dynamics <strong>Modeling</strong>In order to model the dynamic behavior <strong>of</strong> the vehicles, all the forces applied to thevehicle should be known. Figure 4-1 shows all the forces applied to the vehicle climbinga grade. It should be noted that here the effect <strong>of</strong> forces in the longitudinal direction isconsidered because the movement <strong>of</strong> vehicle in latitudinal direction is not considerable[12], [13], [10]. By the use <strong>of</strong> Newton’s law all the forces are divided into two forces, theforces in the direction <strong>of</strong> movement, F t , which is applied to the wheels <strong>of</strong> the vehicle, <strong>and</strong>F tr , the resistance forces that are applied in the opposite direction <strong>of</strong> the vehiclemovement. The Newtons’ law is written as:dVdt∑∑Ft− Ftr= ( 4-1)MvFigure 4-1 Vehicle longitudinal forcesWhere V is the vehicle linear speed, M v is the total weight <strong>of</strong> the vehicle, F t is the tractionforce applied from the tyres to the ground <strong>and</strong> F tr is equivalent resistance forces. Theresistance forces applied to the vehicle are divided into three types. The first one is calledrolling resistance which is due to hysteresis in the tyre material. The deflection <strong>of</strong> thetyre, causes the distribution <strong>of</strong> the ground reaction forces on the wheel <strong>and</strong> it is shifted tothe lead half <strong>of</strong> the wheel. The shifted force <strong>and</strong> the normal load on the wheel cause atorque that resists against the movement <strong>of</strong> the vehicle [10], [11]. This is shown in figure4-2.15
Figure 4-2: The deflection <strong>of</strong> tyre <strong>and</strong> rolling resistanceThe torque caused by shifted ground reaction force is:T r= P × a( 4-2)In order to compensate this torque, a torque should be applied to the wheel with theopposite direction so:FTr P × a= = = P Cr( 4-3)r rRolling×d dWhich Cr is called the rolling resistance coefficient <strong>and</strong> P is the normal load on thewheel. The rolling resistance force is in the opposite direction <strong>of</strong> the vehicle movement<strong>and</strong> if the vehicle is climbing a grade the normal force will decrease so the aboveequation should be multiplied by Cosα which α is the angle <strong>of</strong> the grade in degree. Therolling resistance <strong>of</strong> the vehicle is not constant <strong>and</strong> there are so many factors affecting <strong>its</strong>value including tyre pressure, tyre temperature, tyre material, road material <strong>and</strong> vehiclespeed <strong>of</strong> which speed is more important than the other ones. The rolling resistancecoefficient will change according to the following equation with speed especially in lowspeeds for a passenger car [10].VCr = 0.01(1 + )( 4-4)100The other resistance is the aerodynamic resistance which is caused because <strong>of</strong> two things.Shape drag <strong>and</strong> skin effect. [11], [14], [10].The aerodynamic force is calculatedaccording to the following equation.16
F +2Aerodynamic= 0.5ρ AfCd( V Vw)( 4-5)Where ρ is the air density, A f is the frontal area <strong>of</strong> the vehicle, C d is aerodynamiccoefficient, V is the vehicle speed <strong>and</strong> V w is the wind speed. The aerodynamic coefficientis different for different vehicle shapes. Table 4-1 shows some <strong>of</strong> the values for differentbody shapes.Table 4-1 Drag coefficient for different body shapesVehicle TypeCoefficient <strong>of</strong> Aerodynamic ResistanceBuses 0.6-0.7Trucks 0.8-1.5Motorcycles 0.6-0.7Van body 0.5-0.7Ponton body 0.4-0.55The other resistance force is applied when the vehicle is climbing <strong>of</strong> a grade. As it isshown in Figure 4-1 a force in the opposite direction <strong>of</strong> the vehicle movement is appliedwhich is found by the following equation:Fgrade = MvgSin(α)( 4-6)Where g is the earth gravity <strong>and</strong> M v is the total weight <strong>of</strong> the vehicle. Now that all theforces along the direction <strong>of</strong> vehicle movement have been clarified, the Newton’sequation is formed as:dVMv= Ft− ( Faerodynamic+ Frolling+ Fgrade)( 4-7)dt4.1 Wheel Dynamics <strong>and</strong> Wheel slipAll the force which is applied to the shaft <strong>of</strong> the vehicle wheel will not be transferred tothe ground <strong>and</strong> consequently become a tractive force. It means that applying a tractive orbraking force to the wheel produces a tractive or braking force to the ground based on theslip <strong>of</strong> the wheel [10], [8], [11], [12]. The slip ratio is defined as:V expected−Vactualλ =( 4-8)V expectedIn order to find the slip correctly, it should be considered that during breaking <strong>and</strong>acceleration slip is found by:17
V −Vwheel actualλa=( 4-9)VwheelV −Vactual wheelλb=( 4-10)VactualWhere a <strong>and</strong> b denotes the slip during acceleration <strong>and</strong> deceleration respectively. Thetraction or braking force which is applied to the ground by the tyre is a product <strong>of</strong> frictioncoefficient between the tyre <strong>and</strong> road <strong>and</strong> the normal load on each wheel.F ( λ ) = μ(λ)Pi = f r( 4-11)t i,Where μ (usually between 0.1 to 0.9) is called the friction coefficient <strong>and</strong> it changes withthe wheel slip, the type <strong>of</strong> the road <strong>and</strong> tyre material. P is the normal load on each wheel.i is representing either front wheel or rear wheel. Figure 4-3 shows the curve <strong>of</strong> thelateral <strong>and</strong> longitudinal tractive forces versus slip <strong>of</strong> the wheel. It can be seen that in OAsection the increase <strong>of</strong> longitudinal tractive force is linearly proportional to wheel slip.That is because <strong>of</strong> the elasticity <strong>of</strong> the tyre rather than the relative slip between tyre <strong>and</strong>the ground on the contact area [10]. As the torque is applied on the tyre, it is compressedso the distance that it moves is less than the free rolling <strong>of</strong> the tyre. As the tractive forceincreases, the wheel starts slipping with a nonlinear behavior, section AB. Once the drivetorque exceeds the maximum tractive force can be produced by tyre, the wheel becomesunstable <strong>and</strong> the slip increases. It ends up with spinning <strong>of</strong> the wheel. So in order to applythe maximum force to the ground the slip should be held between 15 to 20 percent to getthe maximum tractive force during acceleration. This is achieved by controlling the slip<strong>of</strong> the wheel. It is also seen in figure 4-3 that there is no tractive force when slip is zero. Itshould be noted that once a torque is applied to wheel <strong>of</strong> the vehicle the tyre is deformeddepending on the tyre material <strong>and</strong> road type <strong>and</strong> a slip is created. It means that having azero slip during applying torque (driving or braking) is not possible.Figure 4-3 Tractive for change with slip <strong>of</strong> tyre18
4.1.1 Normal load on each wheel.The normal load on each rear <strong>and</strong> front axles for a passenger car depends on thedimension <strong>and</strong> shape <strong>of</strong> it. The normal load for a passenger car is found according to thefollowing equation [11].LhbgrddVWf= MvgCosα− ( Fgrade+ FAerodynamic+ MvgCrCosα+ Mv)LLhdtWr=LaLMvhggCosα− ( FLgrade+ FAerodynamic+ MvgCrrhdggCosα+ MvdVdt)( 4-13)Where h g is the height <strong>of</strong> vehicle center <strong>of</strong> gravity from the ground, L a <strong>and</strong> L b are thedistances <strong>of</strong> the front axle <strong>and</strong> the rear axle from the center <strong>of</strong> gravity respectively. L isthe total distance between front ant rear axles. The dimensions are shown in figure 4-1.As in passenger vehicles the center <strong>of</strong> application <strong>of</strong> aerodynamic force, h w <strong>and</strong> thegravity force are near the same height, h g , so the above equations are simplified toWWfr==LLbLaLMMvvhggCosα− ( FtLhggCosα− ( FtLrd− Fr(1 − ))hr− Fr(1 −hdgg))( 4-14)Where F t is the sum <strong>of</strong> front <strong>and</strong> rear tractive forces <strong>and</strong> F r is the sum <strong>of</strong> front <strong>and</strong> rearrolling resistance. r d is the effective radius <strong>of</strong> the wheel.4.1.2 Friction coefficient <strong>and</strong> slip modelingExperimental studies have produced several clearly defined friction/slip characteristicsbetween the tyre <strong>and</strong> road surface for a variety <strong>of</strong> different driving surfaces <strong>and</strong>conditions [12]. For the purposes <strong>of</strong> simulation, four types <strong>of</strong> road condition are modeled:• Normal: The road is dry <strong>and</strong> maximum traction is theoretically possible.• Wet/Raining: Overall traction is reduced by about 20 %.• Snow: Un-packed snow lies on the road surface. Maximum traction reduced by 65 %.• Ice: Packed frozen snow <strong>and</strong> black ice lie on the road surface. Highly dangerous –maximum traction reduced by 85 %.Graphically, these four conditions are shown in figure 4-5 below:20
Figure 4-5 Friction coefficient change with slip for different road typesFor a given set <strong>of</strong> tyre test data, several analytical models exist to analyze <strong>and</strong> simulatethese relationships. The most popular <strong>of</strong> which is the Pacejka “magic” model. ThePacejka model is defined mathematically as follows:μ ( λ ) = Dsin(C arctan( Bλ− E(Bλ− arctan( Bλ)))) i = r f ( 4-15)i iiii,The model defines in excess <strong>of</strong> 40 constants that are determined from the given set <strong>of</strong>experimental data, <strong>and</strong> the overall model coefficients B, C, D <strong>and</strong> E are then calculatedfrom a combination <strong>of</strong> these constants. The required model coefficients to produce theslip/friction relationships as shown in the graph above were determined from some testdata <strong>and</strong> are shown in table 4-3:Table 4-3 Pacejka coefficients for different road typesPacejka coefficientSurface B C D EDry Tarmac 10 1.9 1 .97Wet Tarmac 12 2.3 .82 1Snow 5 2 .3 1Ice 4 2 .1 1As mentioned before in the simulation <strong>of</strong> the tyre the drive torque applied the wheelshould not exceed the maximum tractive force can be produced by tyre otherwise themodel becomes unstable <strong>and</strong> some chatterings are seen in the simulation.The maximum tractive force which can be applied to the front <strong>and</strong> rear wheels is themultiplication <strong>of</strong> the friction coefficient <strong>and</strong> the normal load on the wheel. For a frontwheel driven vehicle it is [11]:21
Ft maxLhbg= μ. Wf= μ(MvgCosα− ( FtmaxLLAnd for rear wheel driven vehicle is:LhagFtmax= μ. Wr= μ(MvgCosα− ( FtmaxLLr− Fr(1 −hdgμM))) =vgCosα[Lb1+μh+ C ( hgr/ Lr μMvgCosα[La+ Cr( hdg− Fr(1 − ))) =h1+μh/ Lggg− r )]/ Ld( 4-16)− r )]/ L( 4-17)If the tractive force applied on the wheels exceeds this maximum force the wheel startsspinning.d4.2 TransmissionIn order to transfer the mechanical torque produced by the traction motor <strong>and</strong> engine tothe wheels <strong>of</strong> the vehicle there are some parts in between that are called transmissionpart. It includes, clutch or torque converter, gear box, final drive, differential <strong>and</strong> driveshaft. It should be noted that most <strong>of</strong> the above transmission parts may not be used in atypical hybrid or electric vehicle. For example the gear box could be replaced by acontinuous vehicle transmission (CVT) part. As the ICE or the electric traction motor hasa limited speed, by using a gear box this limitation could be further increased. Figure 4-6shows the extended operation characteristic <strong>of</strong> a typical 5 ratio gear box connected to acombustion engine.Figure 4-6 Tractive effort <strong>of</strong> internal combustion engine <strong>and</strong> a multi-geartransmission vehicle vs. vehicle speed22
The gear box consists <strong>of</strong> different gears which transmit speed <strong>and</strong> torque <strong>of</strong> the tractionsystem (ICE or electric motor) to the wheels. The clutch is used to connect different gearsto the shaft <strong>of</strong> the traction system. The final drive is also contains different gears thatfurther increases the speed limitation <strong>of</strong> the traction system. It means that by applyinglow ratio gears the dem<strong>and</strong> for higher vehicle speeds is met.For the modeling <strong>of</strong> the transmission system two factors must be considered:• Gear ratio• Transmission efficiencyHaving the transmission efficiency <strong>and</strong> gear ratio the equivalent load torque on the shaft<strong>of</strong> the traction system is calculated. The torque which is applied by the traction source(electric motor or ICE) on the wheels is:T = N × N × η × T( 4-18)wheelgdtransmissiontWhere N g <strong>and</strong> N d are ratio <strong>of</strong> gear box <strong>and</strong> drive line system respectively <strong>and</strong> ή is thetransmission total efficiency <strong>of</strong> the transmission line including clutch, gear box <strong>and</strong> driveline. T t is the torque <strong>of</strong> the traction system.The tractive force on the wheels is:FtT=rwheeld=Ng× Nd× ηrtransmissi ond× Tt( 4-19)The longitudinal speed <strong>of</strong> the vehicle also can be found by the following equation interms <strong>of</strong> vehicle speed:VWt× rd= ( m / s)( 4-20)N × NgdHaving modeled the dynamics <strong>of</strong> the vehicle the torque coming from the engine orelectric motor can easily be connected to the vehicle dynamics model as an input.23
5 Battery <strong>Modeling</strong>As batteries play an important role in hybrid electric vehicles there should be a goodmodel in the simulation tool, representing the actual behavior <strong>of</strong> the battery. There aremany types <strong>of</strong> batteries <strong>and</strong> many factors that affect battery performance. To predict theperformance <strong>of</strong> batteries, different mathematical models exist. None <strong>of</strong> these models arecompletely accurate nor do any include all necessary performance effecting factors.Factors that affect battery performance include:• State <strong>of</strong> charge (SOC)• Battery storage capacity• Rate <strong>of</strong> charge/discharge• Temperature• Age/shelf lifeAccording to what is needed in the simulation, a model for battery is constructed.Generally the models proposed by several scientists could be categorized into 5 groups:• Electrochemical battery models• Equivalent circuit battery models• Dynamic Lumped parameters battery model• Hydrodynamic, finite element type models• Tabulated battery data used models.Here two methods that are commonly used in the simulation <strong>of</strong> hybrid vehicles areintroduced <strong>and</strong> a nonlinear model to use in hybrid vehicle simulations is given.5.1 Electrochemical battery modelsThe simplest models are based solely on electrochemistry. These models ignorethermodynamic <strong>and</strong> quantum effects. Consequently, while these models can predictenergy storage they are not able to model phenomena such as the time rate <strong>of</strong> change <strong>of</strong>voltage under load nor do they include temperature <strong>and</strong> age effects [27].5.1.1 Peukert equationThe Peukert equation, (5-1), is a convenient way <strong>of</strong> characterizing cell behavior <strong>and</strong> <strong>of</strong>quantifying the capacity <strong>of</strong>fset in mathematical terms. This is an empirical formula whichapproximates how the available capacity <strong>of</strong> a battery changes according to the rate <strong>of</strong>discharge [21], [22].In× T = C( 5-1)i24
Where• I = discharge current [amp]• n = battery constant (n=1.35 for typical lead-acid batteries)• T i = time to discharge at current I [seconds]• C= theoretical capacity <strong>of</strong> the battery [ampere hour]Equation 5-1 shows that at higher currents, there is less available energy in the battery.The Peukert Number is directly related to the internal resistance <strong>of</strong> the battery. Highercurrents mean more losses <strong>and</strong> less available capacity. The value <strong>of</strong> the Peukert numberindicates how well a battery performs under continuous heavy currents. A value close to1 indicates that the battery performs well; the higher the number, the more capacity is lostwhen the battery is discharged at high currents. The Peukert number <strong>of</strong> a battery isdetermined empirically. For Lead acid batteries the number is typically between 1.3 <strong>and</strong>1.4.Figure 5-1 shows that the effective battery capacity is reduced at very high continuousdischarge rates. However with intermittent use the battery has time to recover duringquiescent periods when the temperature will also return towards the ambient level. Due tothis potential for recovery, the capacity reduction is less <strong>and</strong> the operating efficiency isgreater if the battery is used intermittently as shown by the dotted line. Note that this isthe reverse <strong>of</strong> the behavior <strong>of</strong> an internal combustion engine which operates mostefficiently with continuous steady loads. In this respect electric power is a better solutionfor delivery vehicles which are subject to continuous interruptions.Figure 5-1 Peukert curve <strong>and</strong> capacity change <strong>of</strong> battery versus discharge current5.1.2 Battery capacity <strong>and</strong> discharge currentThe Peukert relationship can be written to relate the discharge current at one dischargerate to another combination <strong>of</strong> current <strong>and</strong> discharge rate:25
C = C I I( 5-2)( n−1)1 2(2/1)Where• C = capacity <strong>of</strong> the battery• Subscripts 1 <strong>and</strong> 2 refer different discharge-rate statesFrom this relationship the state <strong>of</strong> charge (SOC) at a constant discharge rate is:SOC = 1 − ( I × t)/ C( 5-3)For non-constant discharge rates the above equation must be modified <strong>and</strong> evaluated insmall time steps:ΔSOC = I( 5-4)( n−1)2Δt/ 3600 / C1(I2/ I1)In the equation 5-4, it is assumed that a given combination <strong>of</strong> current <strong>and</strong> discharge rate(C 1 <strong>and</strong> I 1 ) is known. Given the current at the present time step (I 2 ), the correspondingdischarge rate is calculated using 5-2 for C 2 <strong>and</strong> plugged into an incremental form <strong>of</strong>equation for SOC.5.2 Shepherd Model EquationThe Shepherd model is perhaps the best known <strong>and</strong> most <strong>of</strong>ten used battery model forHybrid vehicle analysis. The model describes the electrochemical behavior <strong>of</strong> the batterydirectly in terms <strong>of</strong> voltage <strong>and</strong> current. It is <strong>of</strong>ten used in conjunction with the Peukertequation to obtain battery voltage <strong>and</strong> state <strong>of</strong> charge given power draw variations [23]:Et= E − R I − K ( 1−q)( 5-5)oiiWhere• E t = battery terminal voltage [volts]• E o = open circuit voltage <strong>of</strong> a battery cell when fully charged [volts]• R i = internal (ohmic) resistance <strong>of</strong> the battery [ohms]• K i = polarization resistance [ohms]• C = battery capacity [ampere-hour]• I = instantaneous current [amps]• q = accumulated ampere-hours divided by full battery capacity.The fractional state <strong>of</strong> charge is then found via Peukert's equation.5.3 Unnewehr Universal ModelThe Shepherd model is based on constant current discharges at low current levels. TheShepherd equation tries to find the cut-<strong>of</strong>f point beyond which the terminal voltage26
decreases very rapidly. In electric vehicles, batteries are not usually used at these extremestates <strong>of</strong> depth <strong>of</strong> discharge so Unnewehr <strong>and</strong> Nasar [24] suggest simplifying theShepherd equation asEt= E − R I − K q( 5-6)oiiThe open circuit voltage or no-load battery terminal voltage for this model is simply:Eoc= E − K q( 5-7)oiUnnewehr <strong>and</strong> Nasar go on to define an equivalent internal resistance function:Ri= Ro− KRq( 5-8)Where• R o = total internal resistance <strong>of</strong> a fully charged battery• K R = experimental constantThis equation attempts to model the variation in R i with respect to SOC. By combiningthis equation with <strong>Power</strong>=VI, one can create the following relation to calculate currentduring discharge:2I = ( EOC− ( EOC) − 4Rip)) /(2Ri)( 5-9)And during charge as:2I = ( −E− ( E ) + 4Rp)) /(2R)( 5-10)OCOCThe max power, p, can be computed as:2iip = E OC/(4R)( 5-11)maxi5.4 EQUIVALENT CIRCUIT BATTERY MODELSThese models are modeling the batteries in the shape <strong>of</strong> electronic circu<strong>its</strong>. For example,the capacity <strong>of</strong> the battery is modeled by a capacitor <strong>and</strong> the effect <strong>of</strong> the voltagedeviation in the terminal <strong>of</strong> the battery caused by temperature, state <strong>of</strong> the charge ismodeled by variable resistors <strong>and</strong> controlled voltage sources. There are so many modelsproposed by different scientists but the most commonly used are Thevinin battery model,linear electric model <strong>and</strong> nonlinear electric models.5.4.1 Thevenin battery modelAnother basic battery model describes a battery with an ideal battery voltage (E oc ),internal resistance (R), a capacitance (C o ) <strong>and</strong> over voltage resistance (R o ) [27].The disadvantage <strong>of</strong> this model is that all the parameters in this model are constant but inreality these parameters are changing according to temperature <strong>and</strong> state <strong>of</strong> the charge <strong>of</strong>the battery.27
Figure 5-2: Battery Thevenin modelA new approach to evaluate batteries is a modified model for Thevenin model [16]. Themodified model <strong>of</strong> Thevenin mode is based on operation over a range <strong>of</strong> loadcombinations. The electrical equivalent <strong>of</strong> the proposed model is as depicted in figure 5-3.Figure 5-3: Modified Thevenin modelIn figure 5-3, the main circuit model consists <strong>of</strong> the following five sub-circu<strong>its</strong>:(a) E-battery: This is a simple DC voltage source designating the voltage in the batterycells.(b) E-polarization: It represents the polarization effects due to the availability <strong>of</strong> activematerials in the battery.(c) E-Temperature: It represents the effect <strong>of</strong> temperature on the battery terminal voltage.(d) R: This is the battery's internal impedance, the value <strong>of</strong> which depends primarily onthe relation between cell voltage <strong>and</strong> state <strong>of</strong> charge (SOC) <strong>of</strong> the battery.(e) Voltage_sensor_current: This is basically a voltage source with a value <strong>of</strong> 0V. It isused to record the value <strong>of</strong> battery current.28
Thus, this simulation model is capable <strong>of</strong> dealing with various modes <strong>of</strong>charge/discharge: It is comparatively more precise <strong>and</strong> can be extended for use with Ni-Cd <strong>and</strong> Li-ion batteries, which could be applied to hybrid electric vehicles <strong>and</strong> othertraction applications [16]. Only a few modifications need to be carried out in order tovary the parameters, such as load state, current density, <strong>and</strong> temperature.5.4.2 Linear dynamic modelAn improved variant <strong>of</strong> the Thevenin model is a linear electrical battery model [25]. Thismodel is one step ahead <strong>of</strong> the Thevenin model. It models the behavior <strong>of</strong> the batteryduring overvoltage <strong>and</strong> self discharge <strong>of</strong> the battery. This model, shown in figure 5-4, ismore accurate than the Thevenin model but it still does not consider the change <strong>of</strong> thevalue <strong>of</strong> parameters according to different operating conditions.Figure 5-4:Battery linear model5.4.3 Nonlinear dynamic modelHaving reviewed different modeling methods, it was decided to model the battery by amore realistic dynamic model by modification <strong>of</strong> the Thevenin model. In this model allthe parameters are affected by state <strong>of</strong> charge <strong>of</strong> the battery <strong>and</strong> temperature. This modeltakes into account the variation <strong>of</strong> different parameters with state <strong>of</strong> charge <strong>of</strong> the battery,temperature <strong>and</strong> discharge rate. The model has been shown in figure 5-5. As can be seenin the model it is using two different internal resistances during charging <strong>and</strong> discharging.The diodes in the model are ideal <strong>and</strong> they are used to bypass internal resistances duringcharging or discharging. There is a capacitor in the model which represents the transientbehavior <strong>of</strong> the battery.29
Figure 5-5: Battery nonlinear modelThe circuit is composed <strong>of</strong> two sections:• The battery open circuit voltage which is represented by a controlled dc voltagesource <strong>and</strong> <strong>its</strong> magnitude is changed by state <strong>of</strong> charge <strong>and</strong> temperature.• Internal resistance is modeled by R c <strong>and</strong> R d representing charging <strong>and</strong> dischargingresistances respectively. The value <strong>of</strong> these resistances is changed by the state <strong>of</strong>charge <strong>and</strong> temperature as well. Since during charging <strong>and</strong> discharging the batteryhas two concentrations <strong>of</strong> available reactants so by using two ideal diodesdifferent resistances are put in the circuit during charge <strong>and</strong> discharge.The model is nonlinear in the sense that the elements V OC , R d <strong>and</strong> R c are not constantsbut are modeled as a function <strong>of</strong> state <strong>of</strong> charge <strong>and</strong> temperature. Only C 1 has beenconsidered constant although it is changing with state <strong>of</strong> charge but <strong>its</strong> change is notconsiderable. [17], [18], [19]. Figure 5-6 shows the chart how the look up tables areupdated in each simulation time step.30
VOCRchargeRdischargeSOCTempSOCQmaxTempSOCTempCurrentTimeQusedT=∫ Current × Time0SOC=Qused/QmaxQmaxQmaxTempTempCurrentCurrentSOCTempFigure 5-6 Battery model updating chartIn order to find the state <strong>of</strong> charge <strong>of</strong> the battery, the total capacity (A.h) <strong>of</strong> the batteryshould be considered. As this capacity is changing with discharge/charge current <strong>and</strong>temperature, this change also must be considered in each simulation time step.5.5 Thermal modeling <strong>of</strong> the batterySince the equilibrium potential <strong>of</strong> the battery is temperature dependent, the temperaturemust be resolved dynamically so that it is available for computation <strong>of</strong> the potentialduring each time step. The temperature change <strong>of</strong> the battery is governed by the thermalenergy balance described by:mcpdT ( t)2= Rinti(t)− hcA[T ( t)− Ta]( 5-12)dtWhere A is the total area which thermal energy can be transferred from the battery to theair, C p the heat capacity <strong>of</strong> battery, h c is the cooling coefficient, R int is the internalresistance <strong>of</strong> battery which is different during charging <strong>and</strong> discharging <strong>and</strong> T a is theambient temperature. It must be noted that heat generation in the battery <strong>and</strong>consequently entropy changes in the battery changes the heat capacity but in the thermalmodel because this effect is not considerable it is ignored [28].31
5.6 Parameters measurement5.6.1 Open circuit voltageIn order to measure the open circuit voltage in different state <strong>of</strong> charges <strong>and</strong>temperatures, a constant current is drawn from a fully charged battery in time intervals.After each time interval the open circuit voltage <strong>of</strong> the battery is measured according tothe state <strong>of</strong> charge <strong>of</strong> the battery, shown in figure 5-6 .Once the open circuit voltage getsto a minimum value as given by the manufacturer [26] the battery is totally discharged<strong>and</strong> state <strong>of</strong> charge is zero. Doing some tests on one cell <strong>of</strong> 6 A.h Lithium-ion batteries atthe HVDC research center the battery open circuit voltage versus state <strong>of</strong> charge wasmeasured. The measurement results are shown in figure 5-7. The test was done in threetemperatures <strong>and</strong> with a low current.Figure 5-7 Test procedure for measurement <strong>of</strong> open circuit voltage32
Figure 5-8 Battery open circuit voltage versus state <strong>of</strong> charge5.6.2 Charging <strong>and</strong> Discharging ResistancesIn order to find the charging <strong>and</strong> discharging resistances, a circuit like the one shown infigure 5-8 is used. In each open circuit voltage a resistor is connected to the terminals <strong>of</strong>the battery. Knowing the terminal voltage, open circuit voltage <strong>and</strong> current <strong>of</strong> the battery,the internal resistance <strong>of</strong> battery is measured as:Rint= Rload.( VOC−Vb) / Vb( 5-13)By measuring open circuit voltage <strong>and</strong> terminal voltage in different states <strong>of</strong> charges<strong>and</strong> temperatures the curves, shown in figures 5-9 <strong>and</strong> 5-10, are obtained.33
RintVocFigure 5-9 Circuit for determining <strong>of</strong> open circuit voltageFigure 5-10 Discharge resistance versus state <strong>of</strong> charge34
Figure 5-11 Charging resistance versus state <strong>of</strong> chargeAs can be seen the internal resistances <strong>of</strong> the battery are increased as the state <strong>of</strong> charge<strong>of</strong> the battery decrease. In higher temperatures the internal resistance is less because <strong>of</strong>the free movement <strong>of</strong> the electrons in the electrolyte.5.6.3 CapacitorIn order to consider the transient behavior <strong>of</strong> the battery, the value <strong>of</strong> the capacitor mustbe measured. To find the capacitor, the voltage transient happening during transition fromone load to another load is observed. A circuit model as shown in figure 5-11 is used .Atfirst load R 1 +R 2 is connected. Then the load is switched to only R 1 .The voltage behavior<strong>of</strong> battery is shown in figure 5-12. The transient time between V 1 , when R 1 +R 2 isconnected <strong>and</strong> V b , when R 1 is connected is measured , τ, <strong>and</strong> according to followingequation the value <strong>of</strong> capacitor is calculated.0.63τ = ( R + R C( 5-14)1 int)135
C1RintR1EocVbSwitchR2Figure 5-12 Circuit to determine battery capacitanceFigure 5-13Transient behavior <strong>of</strong> battery terminal voltage during load change5.6.4 Battery capacityAs the capacity <strong>of</strong> the battery depends on the temperature <strong>and</strong> the discharge current [17],in the model, the temperature dependence <strong>of</strong> battery capacitance is estimated by the dataavailable from the manufacturer <strong>and</strong> changes in capacity is applied by look up tables. Thecapacity <strong>of</strong> the battery is used to find the state <strong>of</strong> charge <strong>of</strong> the battery which is explainedin chapter 7.36
6 Engine, electric machine <strong>and</strong> control systemmodeling6.1 Electric motorsThere are different types <strong>of</strong> electric motors which are commonly used in the drive train <strong>of</strong>hybrid electric vehicles. Having a high efficiency compared to internal combustionengines, they have become good traction components in hybrid <strong>and</strong> electric vehicles. DCmotors, permanent magnet synchronous motors (PMSM) <strong>and</strong> switched reluctance motorshave been shown good performance to be used in vehicular applications [2]. Withintroduction <strong>of</strong> developed control methods like vector control they have become reallypopular in vehicle industry. So the modeling <strong>of</strong> electric motors is essential for a vehiclesimulation tool.<strong>Modeling</strong> <strong>of</strong> electric motors could be made in different forms. In some cases the behavior<strong>of</strong> the motor is modeled by look-up tables collected from experimental tests on theefficiency maps <strong>of</strong> motor [2], [1], [7]. The typical efficiency map <strong>of</strong> an electric motor isgiven in different operating points in terms <strong>of</strong> speed <strong>and</strong> torque as shown in figure 6-1.Figure 6-1 Efficiency map <strong>of</strong> a typical PMSM37
There are some models which use the dynamic equation <strong>of</strong> motor [9] <strong>and</strong> they aremodeled by state-space equations. If in a drive train the dynamics <strong>of</strong> every component isin dem<strong>and</strong> then the dynamic models are a good choice. Having the dynamic model <strong>of</strong>electric motors the field oriented control <strong>of</strong> electric machines can be implemented. Infigure 6-2 some dynamic models <strong>of</strong> electric machines used in hybrid electric vehicles areshown.Figure 6-2 Dynamic models for PMSM (left) <strong>and</strong> DC motor (right)As mentioned in Chapter 3 depending on the aim <strong>of</strong> the simulation <strong>and</strong> the level <strong>of</strong>accuracy <strong>and</strong> details desired, there is the possibility to use more detailed models forelectric motors than efficiency maps. The method <strong>of</strong> using look up tables has been usedin this thesis. The static equation <strong>of</strong> a PMSM electric machine is written in Matlab <strong>and</strong>from the considered copper losses <strong>and</strong> iron losses in the machine, the efficiency map <strong>of</strong>the machine is derived [9].6.2 Internal combustion engineIn order to model the behavior <strong>of</strong> the engine there are some methods. In some models aninternal combustion engine can be described with maps, e.g. an efficiency map. Such amap describes the engine power output relative to the fuel power input as a function <strong>of</strong>the engine speed <strong>and</strong> shaft torque. To use look up tables for the modeling <strong>of</strong> the busengine the efficiency maps <strong>of</strong> a diesel engine with the specifications written in table 6-1was studied.Table 6-1 Diesel engine specificationsS.No Parameter Specification1 Engine Type Diesel,D-22 Compression ratio 17.2:13 Displacement 5.88 Liters38
4 Idle speed 840 rpm5 Peak power 150 kw at 1600 rpm6 Charging system Turbo charging,charge air cooledResults based on the test data from the engine efficiency map <strong>and</strong> operation characteristic<strong>of</strong> the engine are shown in figures 6-3 <strong>and</strong> 6-4.Figure 6-3 Engine efficiency mapFigure 6-4 Engine torque & speed characteristic39
When the power requirement varies, so does the operating point. Since the map is adescription <strong>of</strong> the combustion engine performance in stationary operation, the transientbehavior <strong>of</strong> the engine is not considered but with a kind <strong>of</strong> acceptable approximation thetransient change in operating point could be modeled by a first order low pass filter in thecontrol system with the time constant <strong>of</strong> 1.5 seconds. These transient behaviors arecaused by:• Acceleration <strong>and</strong> deceleration <strong>of</strong> gas <strong>and</strong> exhaust flow plugs• Wall-wetting phenomenonThere are some other dynamic modelings <strong>of</strong> the engine which can be used for transientsimulations [3].6.3 Control systemOne <strong>of</strong> the most important parts in the simulation <strong>of</strong> hybrid vehicles is the control system.In hybrid vehicles as there are at least two energy sources, so the power needed fortraction, recharging <strong>of</strong> batteries <strong>and</strong> ultra capacitors auxiliary loads must be provided byenergy sources. The way that this needed power is shared between sources called energymanagement which has some effects on the performance <strong>of</strong> the vehicle. Using differentcontrol strategies, the fuel consumption <strong>and</strong> performance <strong>of</strong> the hybrid drive train couldbe changed [14].40
7 <strong>Modeling</strong> in Simulink/MatlabOnce the analytical approaches have finished regarding each component used in a typicalhybrid drive train it is required to make a model for any <strong>of</strong> the components in asimulation area. All the components including battery, engine, electric motor <strong>and</strong>generator, vehicle dynamics, tyre, automatic driver, driving cycles <strong>and</strong> control system aremodeled in Matlab/Simulink. In the following, the modeling process in Matlab for eachpart is explained.7.1 BatteryOnce all the parameters including charging <strong>and</strong> discharging resistances, open circuitvoltage <strong>of</strong> the battery versus state <strong>of</strong> charge <strong>and</strong> temperature were measured byexperiments, those values are used as look up tables. The model consists <strong>of</strong> three parts:SOC calculation block, voltage calculation <strong>and</strong> thermal modeling block shown in figure7-1. The input <strong>of</strong> the model is the requested power out <strong>of</strong> the battery. According to therequested power using analytical solutions the current <strong>and</strong> terminal voltage <strong>of</strong> the batteryis calculated. As mentioned in chapter 4 during modeling in respect to the direction <strong>of</strong> thepower, charging <strong>and</strong> discharge resistances are selected. As current is drawn out <strong>of</strong> thebattery the total charge drawn out <strong>of</strong> the battery is calculated. Based on the internaltemperature coming from the thermal model <strong>and</strong> current, the maximum capacity <strong>of</strong> thebattery (A.h) is corrected by look-up tables. The charge drawn out <strong>of</strong> the battery isdivided by the maximum capacity <strong>of</strong> battery in a certain current <strong>and</strong> temperature givesthe state <strong>of</strong> charge <strong>of</strong> the battery.In each time step the parameters are updated according to temperature <strong>and</strong> state <strong>of</strong>charge. The maximum charging <strong>and</strong> discharging power, terminal voltage <strong>and</strong> current islimited in the model.41
Figure 7-1 Block diagram <strong>of</strong> battery model7.1.1 Thermal modelAs the battery is charged or discharged, a part <strong>of</strong> the energy is dissipated in the internalresistance. Calculating the power dissipated in the battery <strong>and</strong> using (5-12) gives theinternal temperature <strong>of</strong> the battery. In this model the effect <strong>of</strong> cooling is also considered.As the temperature <strong>of</strong> the battery increases to a certain temperature, a part <strong>of</strong> the heatgenerated in the battery is removed by the cooler. As the temperature exceeds the setvalue the thermal resistance <strong>of</strong> the whole system is decreased. The thermal block diagramis shown in figure 7-2.Figure 7-2 Battery thermal model block diagram7.2 Vehicle dynamicsBased on the analytical equations explained in Chapter 3, the vehicle dynamics model iscreated. As shown in figure 7-3, the inputs <strong>of</strong> the vehicle dynamics model are windspeed, grade <strong>and</strong> tractive forces produced from rear <strong>and</strong> front tyres.42
Figure 7-3 Vehicle dynamics block in Matlab/SimulinkThe model is divided into two important parts as shown in figure 7-4. First are thedynamic equations in longitudinal direction including aerodynamic forces, rollingresistance <strong>and</strong> grade resistance. Second, the part which models the transient normal loadtransfer on the front <strong>and</strong> the rear axles <strong>of</strong> the vehicle. The normal loads on front <strong>and</strong> rearaxles are inputs for the tyre model which will be explained next.43
Figure 7-4 Vehicle dynamic block components7.2.1 TyreIn order to consider the effect <strong>of</strong> wheel slip, it is modeled in the tyre model. As shown infigure 7-5 the inputs for the tyre are the braking <strong>and</strong> driving torque from the driving axlewith respect to the gear ratio, the normal load on wheel <strong>and</strong> the feedback from thelongitudinal speed <strong>of</strong> the vehicle. The longitudinal speed <strong>of</strong> the vehicle is translated torotational speed considering the wheel radius <strong>and</strong> it is compared with the speed <strong>of</strong> thewheel to find the wheel slip. Once the slip is found according to (4-11), the tractive forceapplied to ground is calculated based on the wheel slip <strong>and</strong> normal load on the wheel.Figure 7-5 Tyre block in Matlab/Simulink44
7.3 EngineAs described in Chapter 5 the engine is modeled purely statically using the efficiency map. A set<strong>of</strong> data in terms <strong>of</strong> torque <strong>and</strong> speed <strong>of</strong> the engine <strong>and</strong> the corresponded efficiency <strong>and</strong> specific fuelconsumption in each operating point obtained from the engine <strong>of</strong> a series hybrid bus made by NewFlyer Company is available [28]. Using interpolation <strong>and</strong> extrapolation the efficiency <strong>and</strong> specificfuel consumption in other operating points is found. The transient response <strong>of</strong> the engine ismodeled by a low-pass filter having a 1.5 sec. time constant. The speed <strong>of</strong> the engine can not gohigher <strong>and</strong> lower than a certain value according to the capability curve <strong>of</strong> the engine. So they arelimited in the model.7.4 Electric MotorA permanent magnet synchronous motor is also modeled using look-up tables. Using look-uptables in any operation point the efficiency <strong>of</strong> the electric motor is interpolated. The efficiency map<strong>of</strong> the motor is obtained by using static equations <strong>of</strong> the machine [Appendix]. It should be notedthat in order to find the input power <strong>of</strong> electric motor the average efficiencies <strong>of</strong> gear box <strong>and</strong>wheel axle <strong>and</strong> power electronics components is considered. In the model in order to match theoperating point <strong>of</strong> the electric motor with the data available by look-up tables, field weakeningmust be considered. To apply the field weakening to the model, as the motor speed is increasing, ineach simulation time step the product <strong>of</strong> torque <strong>and</strong> speed <strong>of</strong> the motor is compared with themaximum available power <strong>of</strong> the motor. Once the output power exceeds the maximum power, themotor power is kept constant <strong>and</strong> the torque is decreased inversely proportional to the speed. Thespeed <strong>and</strong> torque are limited according to the capability <strong>of</strong> the machine.7.5 Driving CyclesA vehicle could be driven in different ways. It means that it depends on the driver how to drive thecar in terms <strong>of</strong> acceleration, braking, <strong>and</strong> maximum speed. To simulate a specific vehicle <strong>and</strong>evaluate <strong>its</strong> performance, the way that the driver drives has a significant impact on the vehiclesperformance especially for fuel consumption <strong>and</strong> emissions. So in the simulation drive train, thereshould be different driving cycles. In figure 7-6, two cycles <strong>of</strong> a CBD(city bus driving) used in thesimulation are shown.45
CBD Drive Cycle3530Speed (Km/h)252015105004.89.614.419.22428.833.638.443.24852.857.662.467.27276.8Time (sec)Figure 7-6 City Bus Drive cycle (CBD)The driving cycles are modeled using look-up tables <strong>and</strong> are considered as inputs for thesimulation instead <strong>of</strong> manual pushing <strong>of</strong> brake <strong>and</strong> throttle pedal.7.6 Automatic DriverTo simulate the behavior <strong>of</strong> a driver following up a certain drive cycle, a model isrequired to calculate the required wheel torque. This model is called automatic driver. Itconsists <strong>of</strong> a PI controller having the reference driving cycle, actual speed <strong>of</strong> the vehicle<strong>and</strong> grade as inputs. Its output is the reference wheel torque to trace the drive cycle. Inorder to increase the functionality <strong>of</strong> the PI controller a feed forward loop is used. Thisloop based on the reference speed <strong>and</strong> grade, calculates the traction torque needed fortracing the reference drive cycle. The error between the reference speed <strong>and</strong> the actualspeed is compensated by adding another torque calculated by the PI controller. In order toprevent integrator windup, the integrator is reset each time the speed falls down to zero.The block diagram is shown in figure 7-7.46
Figure 7-7 Automatic driver model block in Matlab/Simulink47
7.7 Control <strong>and</strong> energy ManagementThe control <strong>and</strong> energy management system is made based on a series hybrid drive trainwhich means that the engine is responsible to provide the power needed for traction <strong>and</strong>charging the battery system. The control system based on the needed power for traction<strong>and</strong> charging <strong>of</strong> the battery calculates the power that must be produced by the engine.This power as a reference must be produced by the engine. As long as there is a need forpower to be produced by the engine, the control system sets the speed <strong>of</strong> the engine to aconstant value <strong>and</strong> based on the needed power <strong>and</strong> the engine constraints, thecorresponding engine reference torque is calculated. The reference torque for the electricmotor is the reference torque calculated by the driver model.Since in a series hybrid drive train, the engine <strong>and</strong> generator are coupled to each other, sothey have the same speed. In order to keep the speed <strong>of</strong> the engine constant, aproportional controller is used to set the speed by changing the reference torque <strong>of</strong> thegenerator.The other strategy to find the reference torque <strong>and</strong> speed for the engine is to find thetorque-speed curve <strong>of</strong> engine to have the optimum efficiency. This curve is obtained froman efficiency map <strong>of</strong> the engine.48
8 <strong>Simulation</strong> ResultsIn this chapter first the battery model is verified <strong>and</strong> secondly the drive train <strong>of</strong> a serieshybrid bus is created based on the models previously explained. For simulation purposesthe test data from a series hybrid bus produced by New Flyer Company located in Canadais used. The performance <strong>of</strong> the bus in terms <strong>of</strong> acceleration, fuel economy is studied.8.1 Battery simulation resultsIn order to verify the battery model a 12 volt battery 46 A.h from Hawker Genesis wasused. The fully charged battery was discharged with constant 6 ampere current in ambienttemperature <strong>of</strong> 25 oC . An electronic load (model: <strong>Power</strong> Tek EL12-110M) was used todischarge <strong>and</strong> charge the battery with constant current. For charging, the battery wascharged with constant 30 ampere current. Once the terminal voltage reached to themaximum voltage given by the manufacturer [26], the voltage was kept constant until thebattery was fully charged. Figures 8-1 <strong>and</strong> 8-2 show the results out <strong>of</strong> the simulation <strong>and</strong>tests. It is observed that the model has a good accuracy. The error during charging couldbe because <strong>of</strong> the coulomb efficiency which has not been considered in the model.Figure 8-1 Battery charging test49
Figure 8-2 Battery discharging test8.2 Series hybrid bus simulationThe specifications <strong>of</strong> the series hybrid bus are shown in table 8-1. As the test dataavailable has been obtained from the CBD driving cycle so the CBD driving cycle waschosen as the reference drive cycle. The control strategy used to find the reference speed<strong>and</strong> torque <strong>of</strong> the ICE is to keep the speed <strong>of</strong> the ICE at 1600 rpm during power dem<strong>and</strong><strong>and</strong> 840 rpm when the ICE is idling. The ICE is also responsible to provide the tractionpower <strong>and</strong> keep the state <strong>of</strong> charge <strong>of</strong> the battery to 65%.Table 8-1 <strong>Simulation</strong> data for series hybrid busPropertyValue or TypeFuel typeDieselFuel heating value38000 KJ/lPeak engine power150 kWPeak engine speed2500 rpmEngine minimum speed840 rpmEngine maximum torque895.4 N.mTotal vehicle mass19500 kgWheel radius0.47 mAir resistance 0.65Rolling resistance 0.012Front area 7.4 m 2Air_density 1.29 Kg/m 3Maximum vehicle speed32 km/hPeak generator power160 kW50
Peak generator torque1074 N.mPeak generator speed2500 rpmTotal gear ratio 16.1motor power140 kWmaximum motor torque440 N.mMaximum motor speed950 rpmGearbox efficiency1 s<strong>Power</strong> electronics efficiency 18000Generator-engine inertia 0.2Gear efficiency 0.9Battery typeLithium-ionWheel inertia 27Road typeDry Tarmac<strong>Power</strong> electronics efficiency 0.988.3 Acceleration performanceAcceleration performance <strong>of</strong> a vehicle such as a series hybrid bus studied in this thesis isnormally quoted as the time taken in seconds to reach 105 Km/h from st<strong>and</strong>still. Figure 8-3 shows the acceleration <strong>of</strong> the bus studied from the simulation. As the bus is a rearwheel drive so the speed <strong>of</strong> the rear wheels are higher than the front wheels because <strong>of</strong>slip but in the case <strong>of</strong> the bus the slip is controlled <strong>and</strong> the driving torque applied to thewheels does not exceed maximum value. It is seen in figure 8-4 that during accelerationaround the speed <strong>of</strong> 308 rad/sec. the traction motor gets to <strong>its</strong> maximum power <strong>and</strong> fromthat speed the out-put torque <strong>of</strong> the motor decreases inversely proportional to the speed.Figure 8-3 Acceleration test <strong>of</strong> bus51
Figure 8-4 Wheel speed <strong>and</strong> translated actual vehicle speedIn order to see the effect <strong>of</strong> slip in the simulation, two cases are considered. It should benoted that this simulation test was done to see the effect <strong>of</strong> slip so in this test only thedynamics <strong>of</strong> the vehicle <strong>and</strong> the tire was simulated <strong>and</strong> the constraints regarding tractionmotor <strong>and</strong> engine was ignored so the speed results are not realistic. Firstly a drive torque<strong>of</strong> 7000 N.m is applied to the wheels <strong>and</strong> secondly the drive torque <strong>of</strong> 15000 N.m. It isclearly shown in figure 8-5 that the speed <strong>of</strong> the wheels is higher than the translatoryspeed <strong>of</strong> the vehicle (rotational speed rad/sec). As the wheel torque is increased the slipincreases until it reaches to a value where the friction coefficient is maximum. A little bitincrease in wheel torque leads to wheel spinning.52
Figure 8-5 Wheel speed <strong>and</strong> translated actual vehicle speedAs it is shown in figure 8-5, once a higher drive torque is applied to the wheels, thedifference in the speed <strong>of</strong> wheel <strong>and</strong> translated actual speed <strong>of</strong> the vehicles becomeshigher.8.4 CBD drive cycle testOnce all the parameters related to different components in the series hybrid bus are givenas input to the simulation model. The performance <strong>of</strong> different drive train componentsincluding generator, traction motor, battery <strong>and</strong> engine is analyzed. In figure 8-6 thevehicle speed is shown.53
Figure 8-6 Bus speedAs the bus accelerates, the control system sets the speed <strong>of</strong> the engine to 1600 rpm <strong>and</strong>based on the dem<strong>and</strong>ed torque for traction <strong>and</strong> charging <strong>of</strong> the battery, the referencetorque <strong>of</strong> the engine is calculated. It can be seen in figure 8-7 that the power <strong>of</strong> the engineis opposite to the power <strong>of</strong> the generator but a little bit higher because <strong>of</strong> efficiencies <strong>of</strong>the gear box <strong>and</strong> power electronic converters.54
Figure 8-7 Engine <strong>and</strong> generator power <strong>and</strong> speed curveFigure 8-7 also shows the speed <strong>and</strong> torque characteristic <strong>of</strong> the engine <strong>and</strong> generator. Ascan be seen, the speed <strong>of</strong> the engine jumps between 840 rpm <strong>and</strong> 1600 rpm. When thereis a power dem<strong>and</strong> the engine speed is set to 1600 RPM <strong>and</strong> the reference torqueaccording to the dem<strong>and</strong>ed power <strong>and</strong> engine constraints is calculated. The jumps in thespeed <strong>of</strong> the engine <strong>and</strong> generator are because <strong>of</strong> the dynamics <strong>of</strong> the generator –engineset which has been modeled by a first order system considering the inertia <strong>of</strong> thegenerator-engine set.Figure 8-8 shows the performance <strong>of</strong> electric traction motor. Once the vehicle acceleratesthe torque <strong>of</strong> the motor is maximum as the speed reaches the maximum speed. In thecycle the acceleration is zero so the motor power suddenly decreases because it does nothave to overcome the inertia <strong>of</strong> the vehicle <strong>and</strong> accelerate the total weight <strong>of</strong> it. It can alsobe seen that during the deceleration the power is negative which indicates that energy isbeing fed back to the motor to charge the batteries. The traction power <strong>and</strong> efficiencyincludes the efficiencies <strong>of</strong> gear box <strong>and</strong> power electronics.55
Figure 8-8 Electric motor torque, speed <strong>and</strong> efficiencyFigure 8-9 shows the engine power, generator power, traction power <strong>and</strong> state <strong>of</strong> charge<strong>of</strong> the battery. As the traction power exceeds the maximum engine power the rest <strong>of</strong> theneeded power comes from the battery so the state <strong>of</strong> charge <strong>of</strong> the battery decreases. It isseen that during the deceleration the battery is charged <strong>and</strong> state <strong>of</strong> charge <strong>of</strong> it goes up. Itis also observed that the energy management strategy used in control system tries to setthe state <strong>of</strong> charge <strong>of</strong> the battery to 65 percent.56
Figure 8-9 Battery state <strong>of</strong> charge changeIn order to find the fuel economy, the efficiency <strong>of</strong> the engine in different operatingpoints in terms <strong>of</strong> torque <strong>and</strong> speed is very important. The fuel power, average efficiency<strong>of</strong> the engine <strong>and</strong> fuel consumption results from the simulation are shown in figure 8-10.57
Figure 8-10 Fuel power, fuel consumption <strong>and</strong> average engine efficiencyThe fuel economy <strong>of</strong> the bus was compared by the value obtained form the test dataprovided by New Flyer Company on CBD drive cycle. The results are shown in tableTable 8-2 <strong>Simulation</strong> <strong>and</strong> test result for fuel economyBus Model Measured CBD Simulated CBD Error %fuel economy fuel(Km/Liter) economy(Km/Liter)D40LF 1.91 2.04 -6.8Since in the drive train some components like power electronics <strong>and</strong> gear box were notmodeled <strong>and</strong> efficiency <strong>of</strong> them was considered constant to 98% <strong>and</strong> 90% respectively.So it would add some errors to the whole system. To find the efficiency map <strong>of</strong> theelectric motor <strong>and</strong> generator the static equations were only used <strong>and</strong> the transientbehavior <strong>of</strong> the motor was neglected. That would also introduce some errors to thesystem as well.58
9 ConclusionRegarding the significant role <strong>of</strong> modeling <strong>and</strong> simulation in the design process <strong>of</strong> hybridvehicles the principles <strong>of</strong> simulation <strong>and</strong> some modeling methods were introduced.Different hybrid configurations <strong>and</strong> the drive train components including engine, electricmotor, vehicle dynamics, <strong>and</strong> batteries were explained. In order to create a series hybridbus, different components in the series drive train including vehicle dynamics, battery,engine, electric machine, automatic driver, tyre <strong>and</strong> energy management <strong>and</strong> controlsystem were modeled.1. Different models used for battery modeling were discussed. A nonlinear model for alithium-ion battery was given. In spite <strong>of</strong> simple models used for batteries in hybridvehicles simulations, a kind <strong>of</strong> nonlinear model was made, in which the modelparameters change with the state <strong>of</strong> charge <strong>of</strong> the battery, temperature <strong>and</strong> discharge rate.The parameters <strong>of</strong> the battery were obtained from some tests done at HVDC researchCompany.The model is developed in Simulink/Matlab.2. The dynamics <strong>of</strong> the vehicle were discussed <strong>and</strong> based on these dynamics a model inSimulink/Matlab was developed. The parameters <strong>of</strong> the vehicle dynamics model werecollected from a series hybrid bus test data provided by New Flyer Company. Thesimulation result obtained from the model was validated by the test data <strong>of</strong> the bus forfuel economy.3. The effect <strong>of</strong> wheel slip <strong>and</strong> dependence <strong>of</strong> tractive force on the road type wasmodeled by tyre modeling. It was shown that there is a slip between the wheel speed <strong>and</strong>the vehicle speed.4. Using efficiency maps, the engine, electric motor <strong>and</strong> generator in the drive train weremodeled.Finally a series hybrid drive train was made in Simulink/ Matlab. Based on theparameters <strong>of</strong> a series bus from New Flyer Company the results <strong>of</strong> the simulation werecompared with the test data. It was observed that the control strategy plays an importantrole in the fuel economy <strong>of</strong> the vehicle. Comparing the results <strong>of</strong> fuel economy <strong>and</strong> fuelconsumption obtained from simulation <strong>and</strong> test data showed that by using more accuratemodels for engine, gear box, power electronics, the benef<strong>its</strong> <strong>of</strong> a good simulation modelwill become more <strong>and</strong> more dominant.9.1 Future WorkTo have more information about details <strong>of</strong> different components in the drive train, it isrecommended:1. To use dynamic models for electric machines <strong>and</strong> power electronics. In this case, thetransient behavior <strong>of</strong> the machine is more observed. Having access to electric parameters59
<strong>of</strong> the machine like current, voltage helps a lot to size components during the designprocess.2. Other energy storage systems like capacitors <strong>and</strong> ultra capacitors must be modeled <strong>and</strong>effects <strong>of</strong> them in the drive train must be observed <strong>and</strong> analyzed.3. Since most <strong>of</strong> the vehicle simulations are tested under different drive cycles <strong>and</strong> thebattery is continuously charged <strong>and</strong> discharged the effect <strong>of</strong> cycling on the battery lifemust be considered during modeling. It would be beneficent if the model considers lifecycling as well.Finally, it should be noted that by creating more component models in the library <strong>of</strong>simulation environment, different batteries, engines for instance, testing different drivetrain configurations will become available <strong>and</strong> consequently getting to an optimumdesign becomes more achievable.60
References[1] Shuo Tian, Guijun Cao,Qiang Han, Jiangiu Li, Minggao Yang, “<strong>Modeling</strong> <strong>and</strong>Decoupling Control <strong>of</strong> ICE APU with Uncontrolled Rectifier in Series HybridVehicle”, Vehicle <strong>and</strong> power propusion conference, p.p 1-6, Sept. 2006[2] Pugsley. G., Chillet, C., Fonseca, A., Bui-Van, A. L., “ New <strong>Modeling</strong>Methodology for Induction Machine Efficiency mapping for Hybrid Vehicles”,Electric Machines <strong>and</strong> Drives Conference,2003. IEMDC03. IEEE International,vol.2, p.p. 776-781, Jun. 2003[3] Shangumunathan, U., Govarthanan, R., Muthumailvaganan, Imayakumar A.,“<strong>Modeling</strong> <strong>and</strong> Dynamic <strong>Simulation</strong> <strong>of</strong> IC engine Driven Permanent MagnetGenerator Using Matlab/Simulink for Hybrid Tracked Vehicle”, IEEEConference on Electric <strong>and</strong> Hybrid Vehicles, p.p. 1-6, 2006[4] Cherefils, A.R., Filizadeh, S., “<strong>Modeling</strong> <strong>and</strong> Transient <strong>Simulation</strong> <strong>of</strong> an All-Electric Terrain Vehicle(ATV), Canadian Conference on Electrical <strong>and</strong> ComputerEngineering, p.p. 401-404, 2007[5] Northcott, D.R., Filizadeh, S., “Electromagnetic Transient <strong>Simulation</strong> <strong>of</strong> HybridElectric Vehicles”, IEEE International Symposium on Industrial Electronics,p.p.833-838, June 2007[6] Filizadeh S., Cheverfils A.R., Northcott D.R, “Analysis <strong>and</strong> Design <strong>of</strong> <strong>Vehicular</strong><strong>Power</strong> <strong>Systems</strong> Using PSCAD/EMTDC”, IEEE Vehicle , <strong>Power</strong> <strong>and</strong> PropulsionConference, 2007[7] S.Williamson S., Emadi A., Rajashekara, “Comprehensive Efficiency <strong>Modeling</strong><strong>of</strong> Electric Traction Motor Drives for Hybrid Electric Vehicle PropulsionApplications”, IEEE Transactions on <strong>Vehicular</strong> Technology, Vol.56, No.4, p.p.1561-1572, July 2007[8] Gao, D.W.;Mi, C.;Emadi, A., “<strong>Modeling</strong> <strong>and</strong> <strong>Simulation</strong> <strong>of</strong> Electric HybridVehicles”, Proceedings <strong>of</strong> the IEEE, Vol.95, issue 4, p.p. 729-745, April 2007[9] Onoda, S.; Emadi, A., “PSIM-based <strong>Modeling</strong> <strong>of</strong> Automotive <strong>Power</strong><strong>Systems</strong>:Conventional, Electric, <strong>and</strong> Hybrid Electric Vehicles”, IEEETransactions on <strong>Vehicular</strong> Technology, Vol.53, Issue 2, p.p. 390-400, March2004[10] J.Y. Wong, “Theory <strong>of</strong> Ground Vehicles”, Third edition, United States <strong>of</strong>America, John Wiley & Sons. Inc., 2001[11] Ehsani M., Yimin Gao, Sebastien E. Gay, Emadi A., “Modern Electric, HybridElectric, <strong>and</strong> Fuel Cell Vehicles Fundamentals, Theory, <strong>and</strong> Design”, UnitedStates <strong>of</strong> America, CRC Pres LLC, 2005[12] Ming Qian, “Sliding Mode Controller Design for ABS System”, Master Thesis,Poly Technic Institute <strong>and</strong> State University[13] Michael Short, Michael J. Pont, Qiang Huang, “<strong>Simulation</strong> <strong>of</strong> VehicleLongitudinal Dynamics”, ESL Technical Report ESL 04/01, University <strong>of</strong>Leicester, 200461
[14] Jalil, N.; Kheir, N.A. ;Salman, M. ,”A Rule -Based energy management Strategyfor a Series Hybrid Vehicle”, Proceeding <strong>of</strong> American Control Conference, Vol.1,p.p. 689-693, June 1997[15] Amrhein Macro; Philip T. Krein, “Dynamic <strong>Simulation</strong> for Analysis <strong>of</strong> HybridElectric Vehicle <strong>Systems</strong> <strong>and</strong> Subsystem Interactions, Including <strong>Power</strong>Electronics”, IEEE Transactions on <strong>Vehicular</strong> Technology, Vol.54, No.3, p.p.825-836, May 2005[16] Marcos, J.; Laga A.; Penalver, C.m.;Doval, J. ; Nogueira, A. ;Castro, C.;Chamadoira, J., “An Approach to Real Behavior <strong>Modeling</strong> for Traction LeadacidBatteries”, <strong>Power</strong> electronics Specialists Conference,2001 , IEEE 32 ndAnnual , Vol.2, p.p. 620-624[17] Dur Mathias; Cruden Andrew; Sinclair Gair; J.R. McDonald, “Dynamic Model<strong>of</strong> a Lead-acid Battery for Use in a Domestic Fuel Cell System”, Journal <strong>of</strong> <strong>Power</strong>Sources, Vol.161, Issue 2, , p.p. 1400-1411,Oct. 2006[18] Salameh, Z.M.; Casacca, M.A.;Lynch, W.A, “A Mathematical Model for LeadacidBatteries”, IEEE Transactions on Energy Conversion, Vol.7, Issue:1, p.p. 93-98, March 1992[19] Zhan, C.J.; Wu, X.G.; Kromlidis, S.; Ramach<strong>and</strong>aramurthy, V.K.; Barnes, M.;Jenkins, N.;Ruddell, A.J., “Two Electrical Models <strong>of</strong> The Lead-acid Battery Usedin a Dynamic Voltage Restorer”, Generation, Transmission <strong>and</strong> Distribution, IEEProceedings, Vol.150, Issue:2, p.p. 175-182, March 2003[20] Lijun Gao; Shengyi Liu; Dougal, R.A., “Dynamic Lithium-ion Battery Model forSystem <strong>Simulation</strong>”, IEEE Transactions on Components <strong>and</strong> PachagingTechnologies, Vol.25, Issue: 3, p.p. 495-505, Sep. 2002[21] Dennis Doerffel; Soleiman Abu Sharkh, “A Critical Review <strong>of</strong> Using the Peukertequation for Determining the Remaining Capacity <strong>of</strong> Lead-acid <strong>and</strong> Lithium-ionBatteries”, Journal <strong>of</strong> <strong>Power</strong> <strong>Systems</strong>, Vol.155, Issue: 2, p.p. 395-400, April 2006[22] Bumby, J.R. ; P.H. Clarke; L. Forster,”Computer <strong>Modeling</strong> <strong>of</strong> AutomotiveEnergy Requirements for Internal Combustion Engine <strong>and</strong> Battery Electric<strong>Power</strong>ed Vehicle”, IEE Proceedings, Vol.132, No.5, p.p. 265-279, Sep. 1985[23] Moore s. ;Ehsani M., “An Empirically based Electrosource Horizon Lead-acidBattery Model”, SAE Transactions, Vol.105, n o 6, p.p. 421-424, 1996[24] S.A. Nasar <strong>and</strong> LE “Unnewehr, Electromechanics <strong>and</strong> Electric Machines”,Second Ed., United States <strong>of</strong> America, John Wiley & Sons. Inc., 1993[25] Appebaum, J.; Weiss R., “Estimation <strong>of</strong> Battery Charge in Photovoltaic <strong>Systems</strong>”,16 th IEEE Photovoltaic Specialists Conference, p.p. 513-518, 1982[26] Genesis Application Manual, Fifth Edition, Hawker Energy Products Inc., 1999[27] S.Williamson S.; Rimmalapudi C.; Emadi A., “Electrical <strong>Modeling</strong> <strong>of</strong> RenewableEnergy Sources <strong>and</strong> Energy Storage Devices”, Journal <strong>of</strong> <strong>Power</strong> Electronics,Vol.4, No.2, April 2004[28] New Flyer Co., “Fuel Economy Summary Sheet”, Bus number: 0611, June. 200662


![LAPLACE OPERATOR.ppt [Lecture seule]](https://img.yumpu.com/42909900/1/190x135/laplace-operatorppt-lecture-seule.jpg?quality=85)